![]() Sheldon McIntyre, CMT
Sheldon McIntyre, CMT
Independent Analyst
- Shiba Inu price currently building the right shoulder of a multi-week inverse head-and-shoulders pattern.
- SHIB 200 four-hour SMA has flattened, reflecting a decline in downside momentum.
- Rookie cryptocurrency requires a 38% gain to trigger the new governing pattern.
Shiba Inu price did test the May 19 low again earlier this week but did rebound before testing the June 11 low, establishing the low point of a potential inverse head-and-shoulders pattern. The ongoing rebound has been tentative, suggesting a mild pullback before starting a rally towards the pattern’s neckline. With two four-hour moving averages haunting price, practicing patience and letting the SHIB right shoulder develop is advisable.
Shiba Inu price still lacks the volatility to formalize a march higher
Shiba Inu price collapsed over 40% from the June 15 high of $0.00000986 to the June 22 low of $0.00000560 after being overwhelmed by the selling that gripped the cryptocurrency complex. SHIB did manage to hold the June 11 low, establishing a point to build the right shoulder of the visible inverse head-and-shoulders pattern.
The measured move target of the pattern is $0.00001730, equating to an 82% gain from the neckline and nearly touching the 38.2% Fibonacci retracement level of the May crash at $0.00001754. To reach the neckline at $0.00000945, Shiba Inu price will need to rally close to 40%, overcoming the resistance established by the declining 50 four-hour SMA at $0.00000731 and the 200 four-hour SMA at $0.00000792. It is a long wait for impatient SHIB investors, but it will enhance the trade’s probability of success.
A breakout above the neckline by Shiba Inu price would meet resistance at $0.00001048 and then the merger of the May 24 high at $0.00001204 with the May 20 high at $0.00001214. There is no more meaningful resistance for SHIB until the measured move target of $0.00001730.
It is important to note that other cryptocurrencies formed inverse head-and-shoulders patterns, albeit with a larger footprint, before delivering significant investment returns to investors, such as XRP and ZIL.
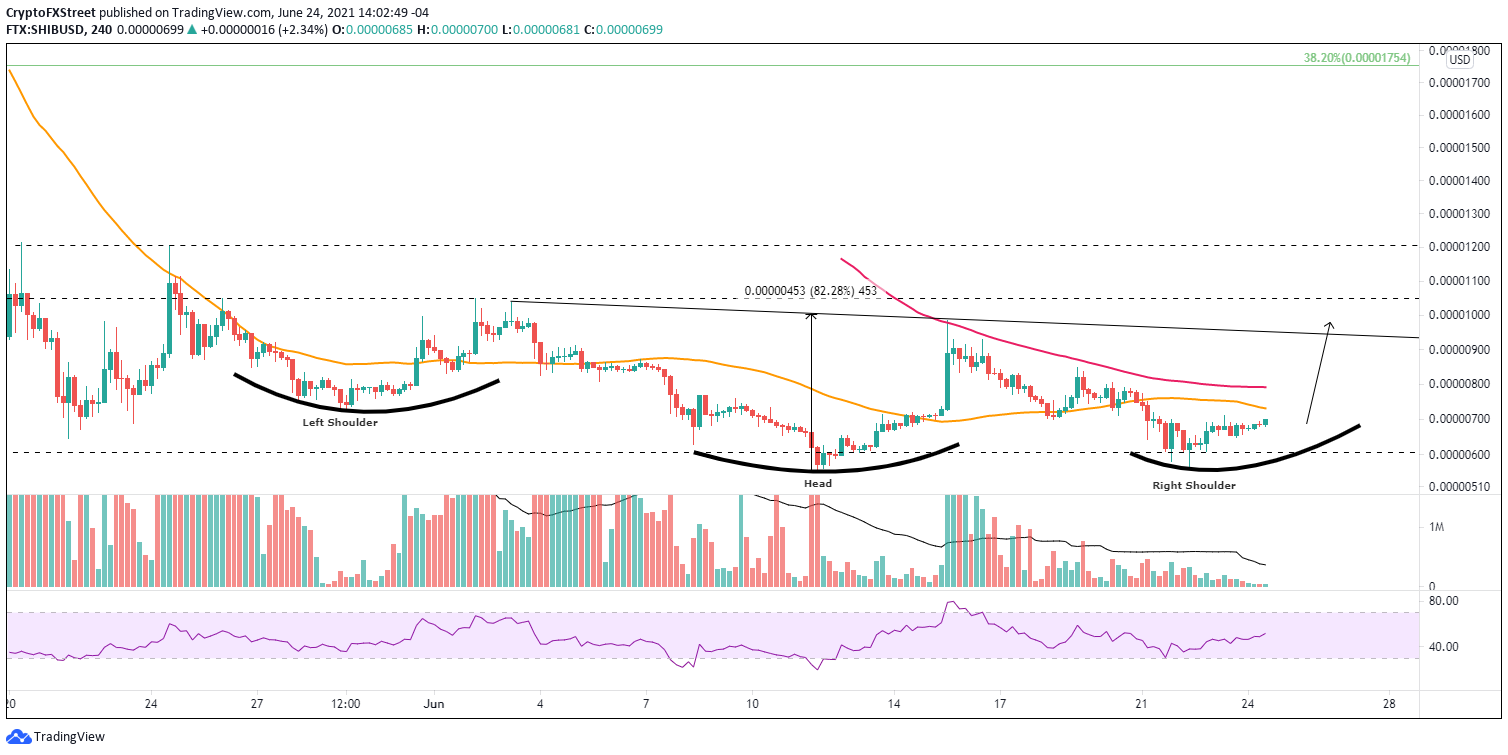
SHIB/USD 4-hour chart
Today, the rebound from the right shoulder low appears corrective, wedging higher on very light volume, possibly indicating that Shiba Inu price weakness has not passed. SHIB may need to revisit the shoulder low at $0.00000560 before staging a purposeful rally towards the pattern’s neckline if that is the case.
A decline below the head’s low at $0.00000550 would void the price structure, exposing Shiba Inu price to notable losses. It is a potential outcome for SHIB should the cryptocurrency market suffer a new wave of selling.
Note: All information on this page is subject to change. The use of this website constitutes acceptance of our user agreement. Please read our privacy policy and legal disclaimer. Opinions expressed at FXstreet.com are those of the individual authors and do not necessarily represent the opinion of FXstreet.com or its management. Risk Disclosure: Trading foreign exchange on margin carries a high level of risk, and may not be suitable for all investors. The high degree of leverage can work against you as well as for you. Before deciding to invest in foreign exchange you should carefully consider your investment objectives, level of experience, and risk appetite. The possibility exists that you could sustain a loss of some or all of your initial investment and therefore you should not invest money that you cannot afford to lose. You should be aware of all the risks associated with foreign exchange trading, and seek advice from an independent financial advisor if you have any doubts.
Recommended Content
Editors’ Picks

Shiba Inu eyes positive returns in April as SHIB price inches towards $0.000015
Shiba Inu's on-chain metrics reveal robust adoption, as addresses with balances surge to 1.4 million. Shiba Inu's returns stand at a solid 14.4% so far in April, poised to snap a three-month bearish trend from earlier this year.

AI tokens TAO, FET, AI16Z surge despite NVIDIA excluding crypto-related projects from its Inception program
AI tokens, including Bittensor and Artificial Superintelligence Alliance, climbed this week, with ai16z still extending gains at the time of writing on Friday. The uptick in prices of AI tokens reflects a broader bullish sentiment across the cryptocurrency market.

Bitcoin Weekly Forecast: BTC consolidates after posting over 10% weekly surge
Bitcoin price is consolidating around $94,000 at the time of writing on Friday, holding onto the recent 10% increase seen earlier this week. This week’s rally was supported by strong institutional demand, as US spot ETFs recorded a total inflow of $2.68 billion until Thursday.

XRP price could renew 25% breakout bid on surging institutional and retail adoption
Ripple price consolidates, trading at $2.18 at the time of writing on Friday, following mid-week gains to $2.30. The rejection from this weekly high led to the price of XRP dropping to the previous day’s low at $2.11, followed by a minor reversal.
Bitcoin Weekly Forecast: BTC consolidates after posting over 10% weekly surge
Bitcoin (BTC) price is consolidating around $94,000 at the time of writing on Friday, holding onto the recent 10% increase seen earlier this week.

The Best brokers to trade EUR/USD
SPONSORED Discover the top brokers for trading EUR/USD in 2025. Our list features brokers with competitive spreads, fast execution, and powerful platforms. Whether you're a beginner or an expert, find the right partner to navigate the dynamic Forex market.