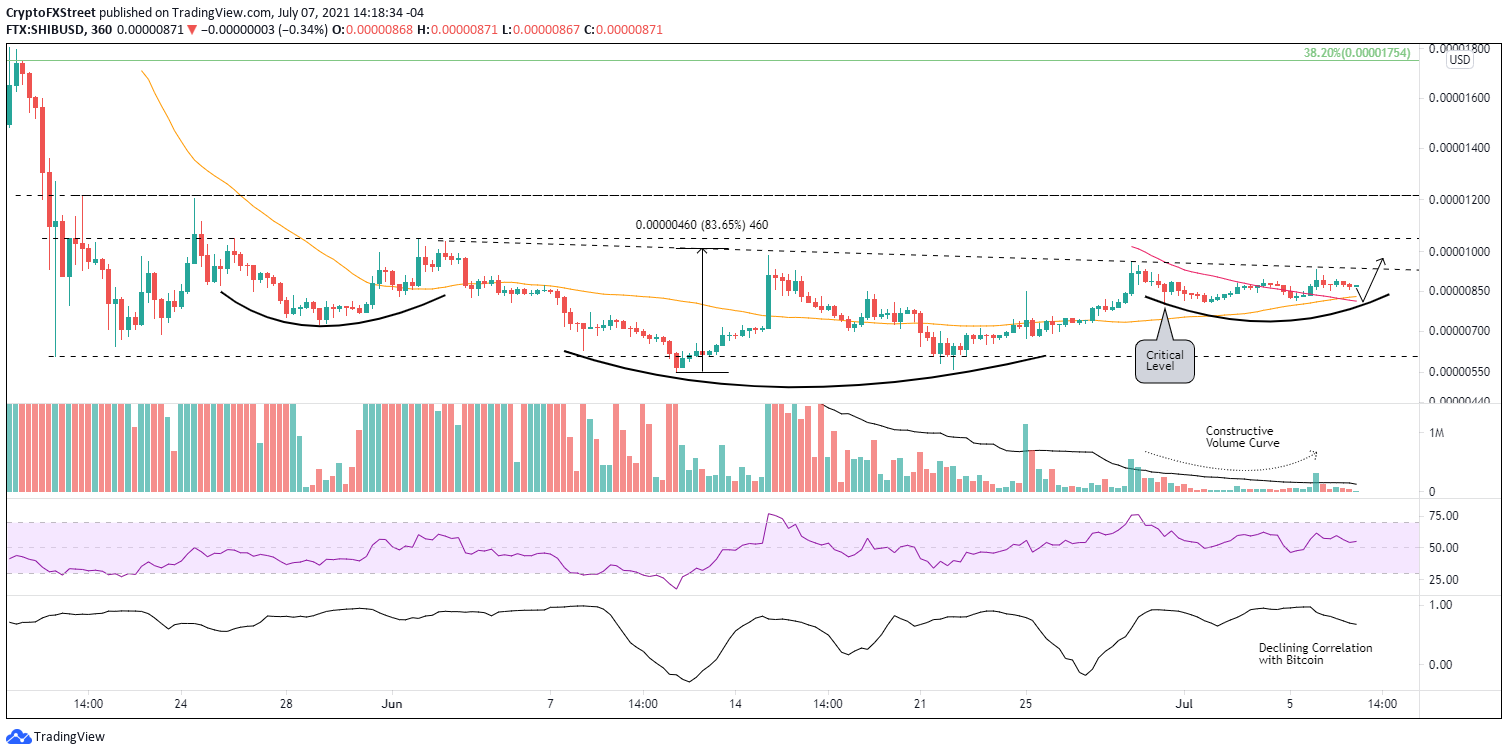
- Shiba Inu price continues the formation of the right shoulder of an inverse head-and-shoulders pattern.
- 50 six-hour simple moving average (SMA) now trending higher, dedicating support to the right shoulder consolidation.
- A decisive close below $0.00000801 would void the bullish SHIB thesis, elevating the odds for a more complex bottom.
Shiba Inu price has been engaged in a multi-week bottoming process that illustrates an inverse head-and-shoulders pattern and a precise trigger. The completion of the right shoulder should be near as SHIB seeks a rally of 80% based on the measured move of the pattern.
Shiba Inu price shows confidence, and volume delivers on conviction
Since the May 19 crash, Shiba Inu price has struggled to plot a constructive bottoming pattern with a timely entry point. Nonetheless, since June 29, SHIB has consolidated confidence in the potential inverse head-and-shoulders pattern with a symmetrical right shoulder inspired by a textbook volume profile.
As Shiba Inu price releases the oversold condition on the intra-day Relative Strength Indexes (RSI) following the 70% spike from the June 22 low to the June 29 high, investors need to monitor the 200 six-hour SMA as it slips through the right shoulder of the formation. Without the support of the strategically important moving average, the challenge increases for a successful resolution of the SHIB pattern.
Of course, it should be mentioned that the 50 six-hour SMA is crossing above the 200 six-hour SMA, triggering a bullish Golden Cross pattern on the six-hour SHIB chart, thereby adding some positivity.
The measured move target of the inverse head-and-shoulders pattern is approximately 80%, projecting a Shiba Inu price of $0.00001720 from the neckline at $0.00000936. The rally would leave SHIB just below the 38.2% Fibonacci retracement level of May’s correction at $0.00001754.
An 80% gain in a perplexing cryptocurrency complex would be a notable achievement for SHIB. However, a more realistic Shiba Inu price target is the resistance between $0.00001204 and $0.00001214, marking the fusion of the May 20 and 24 highs. A rally to $0.00001214 would conclude with a 30% gain from the current position of the neckline at $0.00000936.
Critical to the full realization of the 30% gain is overcoming the minor resistance established by the June 2 high at $0.00001048.
SHIB/USD 6-hour chart
If Shiba Inu price closes below $0.00000801, the bottoming process and the resulting inverse head-and-shoulders pattern will be questioned. A close below that level would eliminate the support provided by the 50 six-hour SMA and, at a minimum, project a more complex right shoulder and, at worst, a reversion to the lows of the head around $0.00000550.
For now, the working thesis is for a bullish resolution of the inverse head-and-shoulders pattern and a rally of at least 30%. The narrative is based on the superior volume profile underlying the head and right shoulder formation, the building of relative strength versus the cryptocurrency market and the growing dominance of altcoins versus Bitcoin over the last two weeks. Combined, they emulate a digital asset trading with conviction and confidence.
Here, FXStreet's analysts evaluate where SHIB could be heading next as it seems bound for higher highs.
Note: All information on this page is subject to change. The use of this website constitutes acceptance of our user agreement. Please read our privacy policy and legal disclaimer. Opinions expressed at FXstreet.com are those of the individual authors and do not necessarily represent the opinion of FXstreet.com or its management. Risk Disclosure: Trading foreign exchange on margin carries a high level of risk, and may not be suitable for all investors. The high degree of leverage can work against you as well as for you. Before deciding to invest in foreign exchange you should carefully consider your investment objectives, level of experience, and risk appetite. The possibility exists that you could sustain a loss of some or all of your initial investment and therefore you should not invest money that you cannot afford to lose. You should be aware of all the risks associated with foreign exchange trading, and seek advice from an independent financial advisor if you have any doubts.
Recommended Content
Editors’ Picks

Bitcoin, Ethereum and XRP steady as China slaps 125% tariff on US, weekend sell-off looming?
The Cryptocurrency market shows stability at the time of writing on Friday, with Bitcoin (BTC) holding steady at $82,584, Ethereum (ETH) at $1,569, and Ripple (XRP) maintaining its position above $2.00.

Bitcoin Weekly Forecast: Market uncertainty lingers, Trump’s 90-day tariff pause sparks modest recovery
Bitcoin price extends recovery to around $82,500 on Friday after dumping to a new year-to-date low of $74,508 to start the week. Market uncertainty remains high, leading to a massive shakeout, with total liquidations hitting $2.18 billion across crypto markets.

Bitcoin, Ethereum, Dogecoin and Cardano stabilze – Why crypto is in limbo
Bitcoin, Ethereum, Dogecoin and Cardano stabilize on Friday as crypto market capitalization steadies around $2.69 trillion. Crypto traders are recovering from the swing in token prices and the Monday bloodbath.

Can FTX’s 186,000 unstaked SOL dampen Solana price breakout hopes?
Solana price edges higher and trades at $117.31 at the time of writing on Friday, marking a 3.4% increase from the $112.80 open. The smart contracts token corrected lower the previous day, following a sharp recovery to $120 induced by US President Donald Trump’s 90-day tariff pause on Wednesday.

Bitcoin Weekly Forecast: Market uncertainty lingers, Trump’s 90-day tariff pause sparks modest recovery
Bitcoin (BTC) price extends recovery to around $82,500 on Friday after dumping to a new year-to-date low of $74,508 to start the week. Market uncertainty remains high, leading to a massive shakeout, with total liquidations hitting $2.18 billion across crypto markets.

The Best brokers to trade EUR/USD
SPONSORED Discover the top brokers for trading EUR/USD in 2025. Our list features brokers with competitive spreads, fast execution, and powerful platforms. Whether you're a beginner or an expert, find the right partner to navigate the dynamic Forex market.
