- Shiba Inu price is moving sideways within a rectangle pattern.
- SHIB holders consider booking early profits, citing massive resistance at $0.00001303
- Holding above the 50-day EMA could invalidate the pessimistic outlook for SHIB price.
Shiba Inu price appears to be consolidating between a horizontal support and resistance. Its recent breakout elevated the second-largest meme coin to highs marginally above $0.00001500. However, SHIB price retreated as investors booked profits. For now, eyes are set on the next direction Shiba Inu will likely take, especially with the risk of a 15% drop becoming apparent.
Shiba Inu price is stuck in consolidation, but not for long
Shiba Inu price is consolidating within the confines of a rectangle pattern. There is buying pressure, but more is needed to burst SHIB on a northbound move.
Sellers will be ready to play if Shiba Inu price fails to hold above the most crucial support, as highlighted by the 50-day Exponential Moving Average (EMA) (in red).
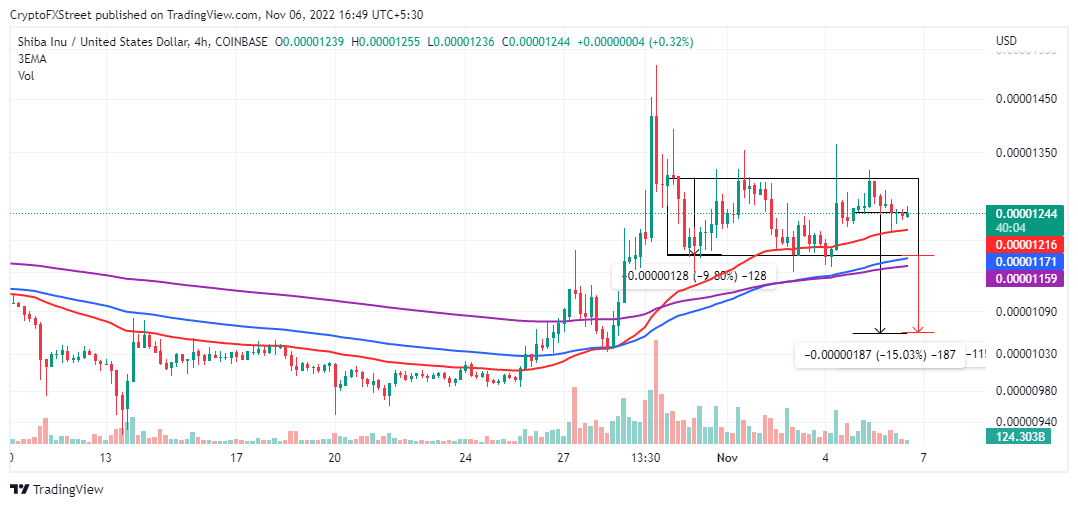
SHIB/USD daily chart
A rectangle pattern appearing on the chart is assumed neutral until Shiba Inu price makes a clear break above or below it. The downtrend preceding the rectangle could increase the chances of SHIB dropping 15% from its current market value.
Traders scanning for short positions must consider Shiba Inu price untradeable until it makes a clean break below the 50-day EMA. An ideal signal would be a break below the rectangle support at $0.00001277 ahead of a 9.80% profit target of $0.00001061.
A bullish breakout in Shiba Inu price is doubtful, especially if the Market Value Realized Value (MVRV) profit model is considered. From the chart below, most SHIB holders realize profits and are likely to sell to lock in the gains while waiting for suitable entry positions downstream.
 [14.20.15, 06 Nov, 2022]-638033316503228140.png)
Shiba Inu MVRV
The MVRV tracks the profit or loss ratio of Shiba Inu holders by taking the price at which the tokens last moved and comparing it to their current market value. Readings above 1 hint at an overvalued asset, often resulting in a spike in overhead pressure.
On the flip side, traders cannot rule out a potential breakout equal to the rectangle's width, extrapolated from the breakout point at $0.00001303. Bulls must start with defending support provided by the 50-day EMA to ensure this breakout materializes.
Information on these pages contains forward-looking statements that involve risks and uncertainties. Markets and instruments profiled on this page are for informational purposes only and should not in any way come across as a recommendation to buy or sell in these assets. You should do your own thorough research before making any investment decisions. FXStreet does not in any way guarantee that this information is free from mistakes, errors, or material misstatements. It also does not guarantee that this information is of a timely nature. Investing in Open Markets involves a great deal of risk, including the loss of all or a portion of your investment, as well as emotional distress. All risks, losses and costs associated with investing, including total loss of principal, are your responsibility. The views and opinions expressed in this article are those of the authors and do not necessarily reflect the official policy or position of FXStreet nor its advertisers. The author will not be held responsible for information that is found at the end of links posted on this page.
If not otherwise explicitly mentioned in the body of the article, at the time of writing, the author has no position in any stock mentioned in this article and no business relationship with any company mentioned. The author has not received compensation for writing this article, other than from FXStreet.
FXStreet and the author do not provide personalized recommendations. The author makes no representations as to the accuracy, completeness, or suitability of this information. FXStreet and the author will not be liable for any errors, omissions or any losses, injuries or damages arising from this information and its display or use. Errors and omissions excepted.
The author and FXStreet are not registered investment advisors and nothing in this article is intended to be investment advice.
Recommended Content
Editors’ Picks

Bitcoin holds $84,000 despite Fed’s hawkish remarks and spot ETFs outflows
Bitcoin is stabilizing around $84,000 at the time of writing on Thursday after facing multiple rejections around the 200-day EMA at $85,000 since Saturday. Despite risk-off sentiment due to the hawkish remarks by the US Fed on Wednesday, BTC remains relatively stable.

Crypto market cap fell more than 18% in Q1, wiping out $633.5 billion after Trump’s inauguration top
CoinGecko’s Q1 Crypto Industry Report highlights that the total crypto market capitalization fell by 18.6% in the first quarter, wiping out $633.5 billion after topping on January 18, just a couple of days ahead of US President Donald Trump’s inauguration.

Top meme coin gainers FARTCOIN, AIDOGE, and MEW as Trump coins litmus test US SEC ethics
Cryptocurrencies have been moving in lockstep since Monday, largely reflecting sentiment across global markets as United States (US) President Donald Trump's tariffs and trade wars take on new shapes and forms each passing day.

XRP buoyant above $2 as court grants Ripple breathing space in SEC lawsuit
A US appellate court temporarily paused the SEC-Ripple case for 60 days, holding the appeal in abeyance. The SEC is expected to file a status report by June 15, signaling a potential end to the four-year legal battle.
Bitcoin Weekly Forecast: Market uncertainty lingers, Trump’s 90-day tariff pause sparks modest recovery
Bitcoin (BTC) price extends recovery to around $82,500 on Friday after dumping to a new year-to-date low of $74,508 to start the week. Market uncertainty remains high, leading to a massive shakeout, with total liquidations hitting $2.18 billion across crypto markets.

The Best brokers to trade EUR/USD
SPONSORED Discover the top brokers for trading EUR/USD in 2025. Our list features brokers with competitive spreads, fast execution, and powerful platforms. Whether you're a beginner or an expert, find the right partner to navigate the dynamic Forex market.