- Shiba Inu price finds support around $0.00001694 the 200-week Exponential Moving Average.
- On-chain data shows SHIB’s capitulation event occurred on June 24 and is poised for a rally.
- A weekly candlestick close below $0.00001690 would invalidate the bullish thesis.
Shiba Inu (SHIB) price found support at the 200-week Exponential Moving Average and is currently trading up 2.3% on Wednesday. On-chain data indicates SHIB experienced a capitulation event on June 24, with supply on exchanges decreasing, suggesting bullish momentum could drive SHIB's price higher in the coming days.
Shiba Inu price shows promise
Shiba Inu price found support at the 200-week Exponential Moving Average (EMA) around the $0.00001694 level and is currently trading at $0.00001757, 2.3% above it on Wednesday.
The 200-week Exponential Moving Average roughly coincides with the weekly support level of $0.00001690, considered a key support level.
If this support level holds, SHIB could rally 18% to retest its resistance level at $0.0000208, the 61.8% Fibonacci retracement level drawn from the weekly swing low of $0.0000054 from June 5, 2023, to the weekly swing high of $0.00004575 from March 4, 2024.
The Relative Strength Index (RSI) on the weekly chart has briefly slipped below the 50 mean level, while the Awesome Oscillator (AO) is on its way to doing the same. If bulls are indeed making a comeback, then both momentum indicators must maintain their positions above their respective mean levels. Such a development would add a tailwind to the recovery rally.
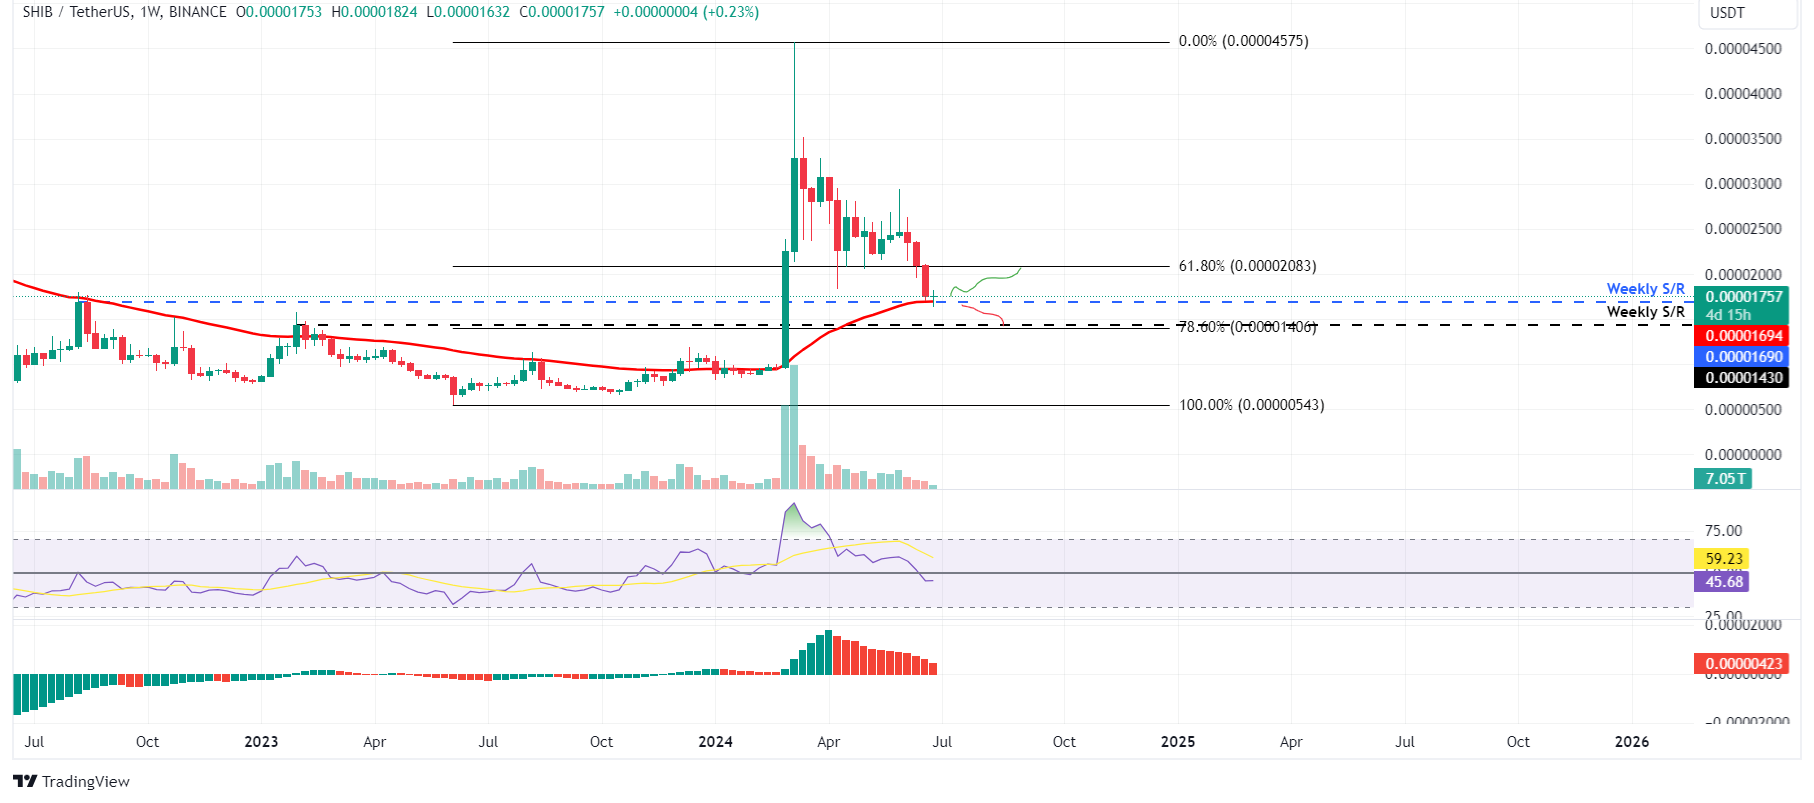
SHIB/USDT weekly chart
Based on IntoTheBlock's Global In/Out of the Money (GIOM), nearly 60,110 addresses accumulated 58.85 trillion SHIB tokens at an average price of $0.000016.These addresses bought the dog-based meme token between $0.000014 and $0.000017, which makes it a key support zone. These investors will likely add more to their holdings if the price retraces.
Interestingly, the $0.000014 to $0.000017 zone mentioned from a technical analysis perspective coincides with the GIOM findings, making this zone a key reversal zone to watch.
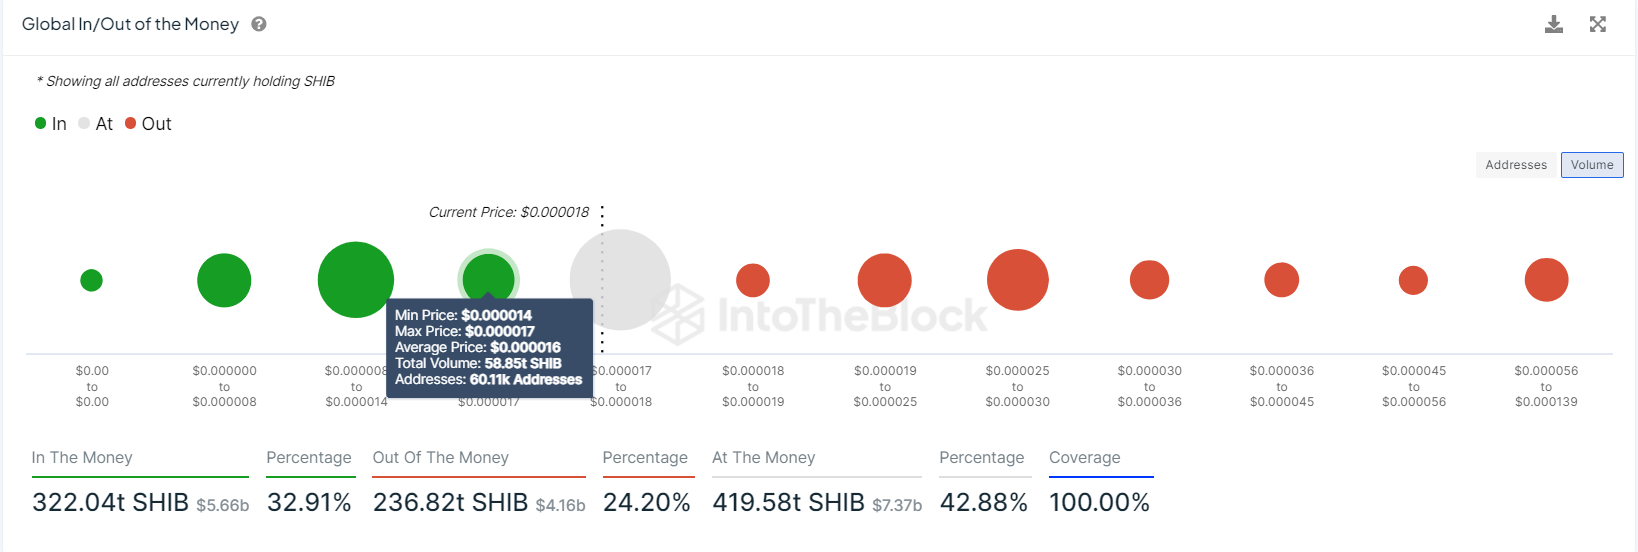
SHIB GIOM chart
On-chain data provider Santiment’s Network Realized Profit/Loss (NPL) indicator computes a daily network-level Return On Investment (ROI) based on the coin’s on-chain transaction volume. Simply put, it is used to measure market pain. Strong spikes in a coin’s NPL indicate that its holders are, on average, selling their bags at a significant profit. On the other hand, strong dips imply that the coin’s holders are, on average, realizing losses, suggesting panic sell-offs and investor capitulation.
In SHIB’s case, the NPL indicator dipped to -1.85 million and -15.08 million on June 23 and 24, coinciding with a 5.28% price decline. This negative downtick indicates that the holders were, on average, realizing losses.
During this capitulation event, the SHIB’s supply on exchanges declined from 73.15 million to 72.5 million in two days. This decrease in supply on exchanges indicates that investors are moving SHIB tokens to wallets and reducing selling activity, signaling a bullish outlook and further denoting investor confidence in Shiba Inu.
%20[15.32.50,%2026%20Jun,%202024]-638550061936295438.png)
SHIB Network Realized Profit/Loss and Supply on Exchanges chart
Even though the on-chain metric and technical analysis point to a bullish outlook, if SHIB’s weekly candlestick closes below $0.00001690, the weekly support level, this move would invalidate the bullish thesis by producing a lower low on a weekly timeframe. This development could see Shiba Inu’s price fall 16% to the next weekly support level of $0.00001430.
Information on these pages contains forward-looking statements that involve risks and uncertainties. Markets and instruments profiled on this page are for informational purposes only and should not in any way come across as a recommendation to buy or sell in these assets. You should do your own thorough research before making any investment decisions. FXStreet does not in any way guarantee that this information is free from mistakes, errors, or material misstatements. It also does not guarantee that this information is of a timely nature. Investing in Open Markets involves a great deal of risk, including the loss of all or a portion of your investment, as well as emotional distress. All risks, losses and costs associated with investing, including total loss of principal, are your responsibility. The views and opinions expressed in this article are those of the authors and do not necessarily reflect the official policy or position of FXStreet nor its advertisers. The author will not be held responsible for information that is found at the end of links posted on this page.
If not otherwise explicitly mentioned in the body of the article, at the time of writing, the author has no position in any stock mentioned in this article and no business relationship with any company mentioned. The author has not received compensation for writing this article, other than from FXStreet.
FXStreet and the author do not provide personalized recommendations. The author makes no representations as to the accuracy, completeness, or suitability of this information. FXStreet and the author will not be liable for any errors, omissions or any losses, injuries or damages arising from this information and its display or use. Errors and omissions excepted.
The author and FXStreet are not registered investment advisors and nothing in this article is intended to be investment advice.
Recommended Content
Editors’ Picks

IRS says crypto staking should be taxed in response to lawsuit
The IRS stated that rewards from cryptocurrency staking are taxable upon receipt, according to a Bloomberg report on Monday, which stated the agency rejected a legal argument that sought to delay taxation until such rewards are sold or exchanged.

Solana dominates Bitcoin, Ethereum in price performance and trading volume: Glassnode
Solana is up 6% on Monday following a Glassnode report indicating that SOL has seen more capital increase than Bitcoin and Ethereum. Despite the large gains suggesting a relatively heated market, SOL could still stretch its growth before establishing a top for the cycle.

Ethereum Price Forecast: ETH risks a decline to $3,000 as investors realize increased profits and losses
Ethereum is up 4% on Monday despite increased selling pressure across long-term and short-term holders in the past two days. If whales fail to maintain their recent buy-the-dip attitude, ETH risks a decline below $3,000.

Crypto Today: BTC hits new Trump-era low as Chainlink, HBAR and AAVE lead market recovery
The global cryptocurrency market cap shrank by $500 billion after the Federal Reserve's hawkish statements on December 17. Amid the market crash, Bitcoin price declined 7.2% last week, recording its first weekly timeframe loss since Donald Trump’s re-election.

Bitcoin: 2025 outlook brightens on expectations of US pro-crypto policy
Bitcoin price has surged more than 140% in 2024, reaching the $100K milestone in early December. The rally was driven by the launch of Bitcoin Spot ETFs in January and the reduced supply following the fourth halving event in April.

Best Forex Brokers with Low Spreads
VERIFIED Low spreads are crucial for reducing trading costs. Explore top Forex brokers offering competitive spreads and high leverage. Compare options for EUR/USD, GBP/USD, USD/JPY, and Gold.