- Shiba Inu sees bulls trying to create a squeeze against $0.00004000.
- Meanwhile, bears are trying to pull a bull trap as they try to push for $0.00002640.
- Expect bulls to take the overhand, and a weekly close above $0.00004000 will see massive investor inflow going into 2022.
Shiba Inu (SHIB) price is a bit stuck between buyers and sellers as bulls are trying to push back above $0.00004000, while bears are trying to trap bulls and get them to be stopped out of their long positions. As SHIB is still a young cryptocurrency in its existence, not all or many technical elements are present, but as the $0.00004000 was the historical high in the first trading week of its existence, it will be essential to see if bulls can break above it to make new all-time highs in 2022. With that high at $0.00009000, bulls will need some external tailwinds to get that far.
SHIB price set to enjoy fresh investor inflow
SHIB price got stuck in a bit of a downtrend after hitting those all-time highs in October, after which price action collapsed and found support around $0.00003000. Since then, price action has been range trading a bit with the historical $0.00004000 proven to be a difficult hurdle to jump above. As bulls tried to push bears against that level to squeeze them out, the lack of momentum and tailwinds made price action dip to the downside this week, starting to form a bull trap. Do not expect any considerable risk to the downside as SHIB is well supported with $0.00003000 and a bit further below at $0.00002640, historical support still waiting to be tested.
As the Relative Strength Index (RSI) is still hovering above the 50-marker, this shows that investors are present and are buying into SHIB, even when the price action is on the back foot. Expect thus sooner rather than later to see a bullish breakout above $0.00004000 as the investor side is starting to enlarge against fewer sellers. A weekly close above $0.00004000 would deliver a bright buy signal to hesitant buyers and bulls looking for an opportunity to get in, which could see a rapid uptick towards $0.00007000, which falls in line with the monthly R1 resistance level.
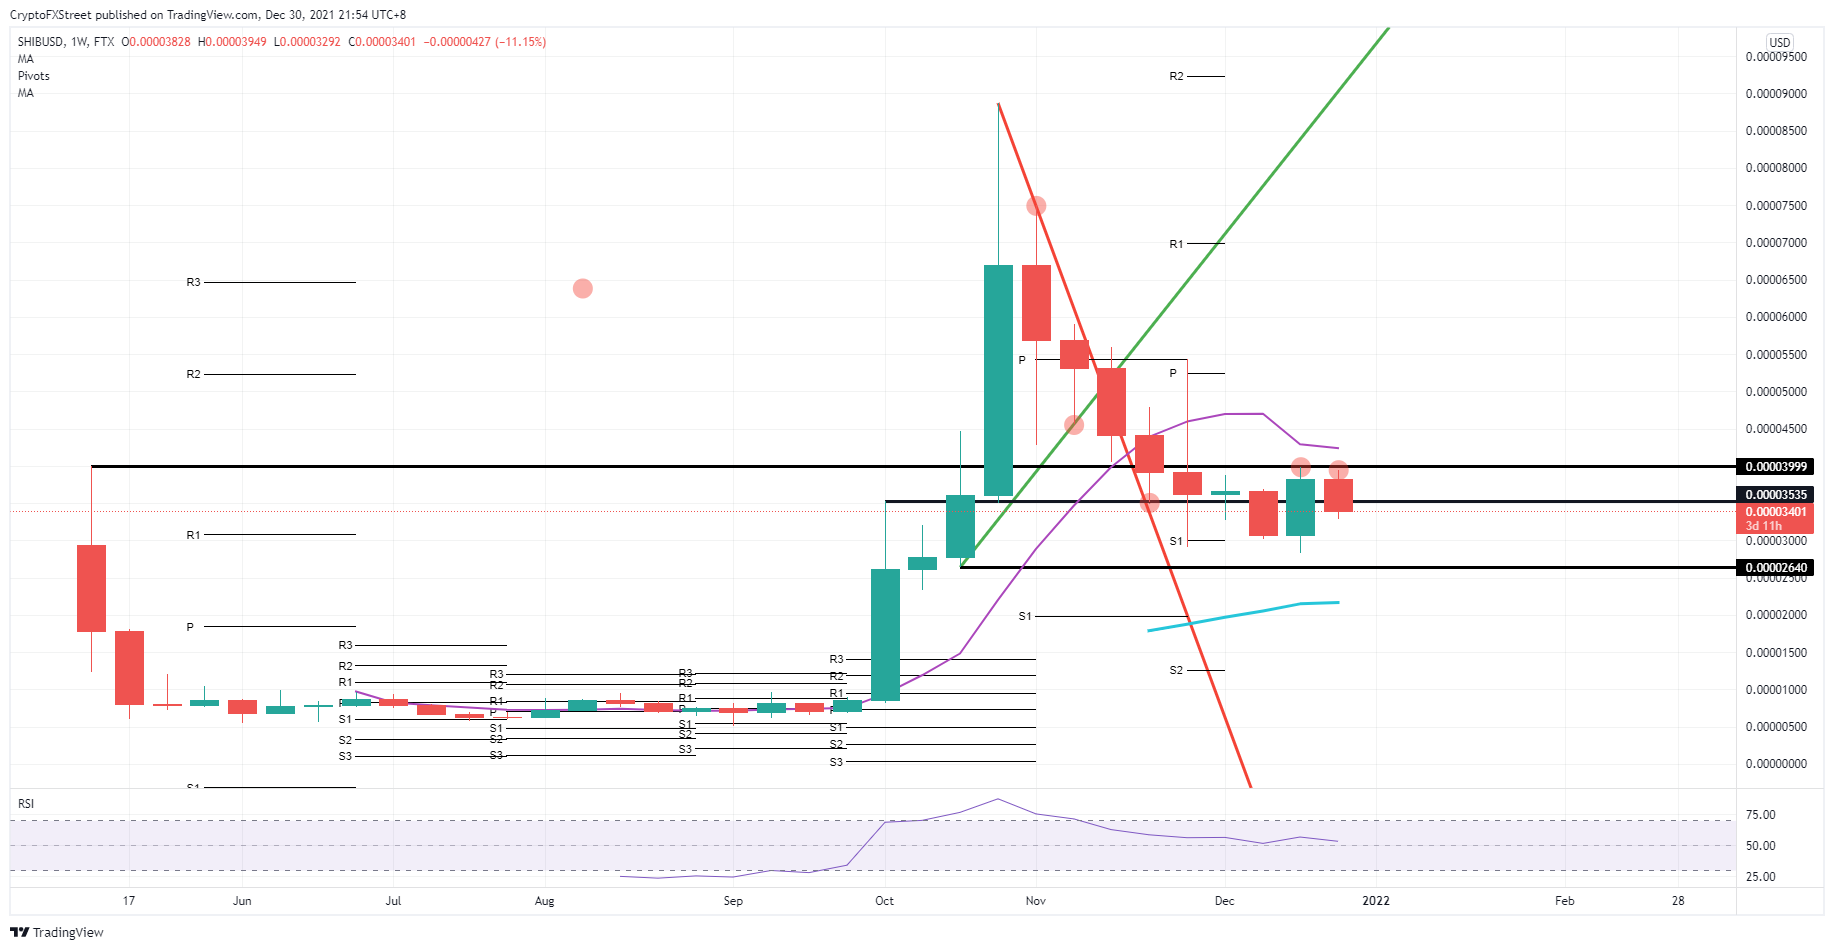
SHIB/USD daily chart
If global markets start 2022 on the back foot, expect to see investors be somewhat hesitant before joining Shiba Inu price action. Expect bears to succeed in their bull trap and dip towards $0.00002640. As this level still has to prove its support, keep in mind that it could not stop the downward price action. The 200-day SMA around $$0.00002000 could be the fail-safe level needed to prevent Shiba Inu from devaluing further.
Information on these pages contains forward-looking statements that involve risks and uncertainties. Markets and instruments profiled on this page are for informational purposes only and should not in any way come across as a recommendation to buy or sell in these assets. You should do your own thorough research before making any investment decisions. FXStreet does not in any way guarantee that this information is free from mistakes, errors, or material misstatements. It also does not guarantee that this information is of a timely nature. Investing in Open Markets involves a great deal of risk, including the loss of all or a portion of your investment, as well as emotional distress. All risks, losses and costs associated with investing, including total loss of principal, are your responsibility. The views and opinions expressed in this article are those of the authors and do not necessarily reflect the official policy or position of FXStreet nor its advertisers. The author will not be held responsible for information that is found at the end of links posted on this page.
If not otherwise explicitly mentioned in the body of the article, at the time of writing, the author has no position in any stock mentioned in this article and no business relationship with any company mentioned. The author has not received compensation for writing this article, other than from FXStreet.
FXStreet and the author do not provide personalized recommendations. The author makes no representations as to the accuracy, completeness, or suitability of this information. FXStreet and the author will not be liable for any errors, omissions or any losses, injuries or damages arising from this information and its display or use. Errors and omissions excepted.
The author and FXStreet are not registered investment advisors and nothing in this article is intended to be investment advice.
Recommended Content
Editors’ Picks

Shiba Inu eyes positive returns in April as SHIB price inches towards $0.000015
Shiba Inu's on-chain metrics reveal robust adoption, as addresses with balances surge to 1.4 million. Shiba Inu's returns stand at a solid 14.4% so far in April, poised to snap a three-month bearish trend from earlier this year.

AI tokens TAO, FET, AI16Z surge despite NVIDIA excluding crypto-related projects from its Inception program
AI tokens, including Bittensor and Artificial Superintelligence Alliance, climbed this week, with ai16z still extending gains at the time of writing on Friday. The uptick in prices of AI tokens reflects a broader bullish sentiment across the cryptocurrency market.

Bitcoin Weekly Forecast: BTC consolidates after posting over 10% weekly surge
Bitcoin price is consolidating around $94,000 at the time of writing on Friday, holding onto the recent 10% increase seen earlier this week. This week’s rally was supported by strong institutional demand, as US spot ETFs recorded a total inflow of $2.68 billion until Thursday.

XRP price could renew 25% breakout bid on surging institutional and retail adoption
Ripple price consolidates, trading at $2.18 at the time of writing on Friday, following mid-week gains to $2.30. The rejection from this weekly high led to the price of XRP dropping to the previous day’s low at $2.11, followed by a minor reversal.
Bitcoin Weekly Forecast: BTC consolidates after posting over 10% weekly surge
Bitcoin (BTC) price is consolidating around $94,000 at the time of writing on Friday, holding onto the recent 10% increase seen earlier this week.

The Best brokers to trade EUR/USD
SPONSORED Discover the top brokers for trading EUR/USD in 2025. Our list features brokers with competitive spreads, fast execution, and powerful platforms. Whether you're a beginner or an expert, find the right partner to navigate the dynamic Forex market.