Shiba Inu price is in for a treat with 45% upside potential
- Shiba Inu has been on a tear since Thursday.
- Bulls will have more upside insight as sellers have no entry points for opposing forces.
- The first target lined up is $0.00001115, which already counts for 26% of gains.
Shiba Inu (SHIB) is surfing on a favorable tailwind and has washed sellers out of their positions, with stops being run. Buyers were in for a rocket launch to the moon, and the trip did not look to be halting anytime soon. With the monthly R1 resistance level at $0.00000900, buyers will want to book some profit, and new buyers will want to average in on a new trade.
Shiba Inu is offering bulls who came too late to the party another entry
Shiba Inu’s price action shot through the roof Thursday and hit the high from August 17, near $0.00000950. This way, SHIB is forming a double top and an incentive for bulls to do better. Buyers will have already booked quite some substantial profit, so the risk is now that this rally could quickly start to fade. A medium-term descending trend line might do the trick to keep buyers in check and add a new volume to the rally. This trend line originates from May 24, and the high of August 17 acted as one of its conformation points. A minor short-term correction is normal as price action in Shiba Inu is overheated. Buyers who want to join the party will use this short-term cooldown as an entry to load up on Shiba Inu coins.
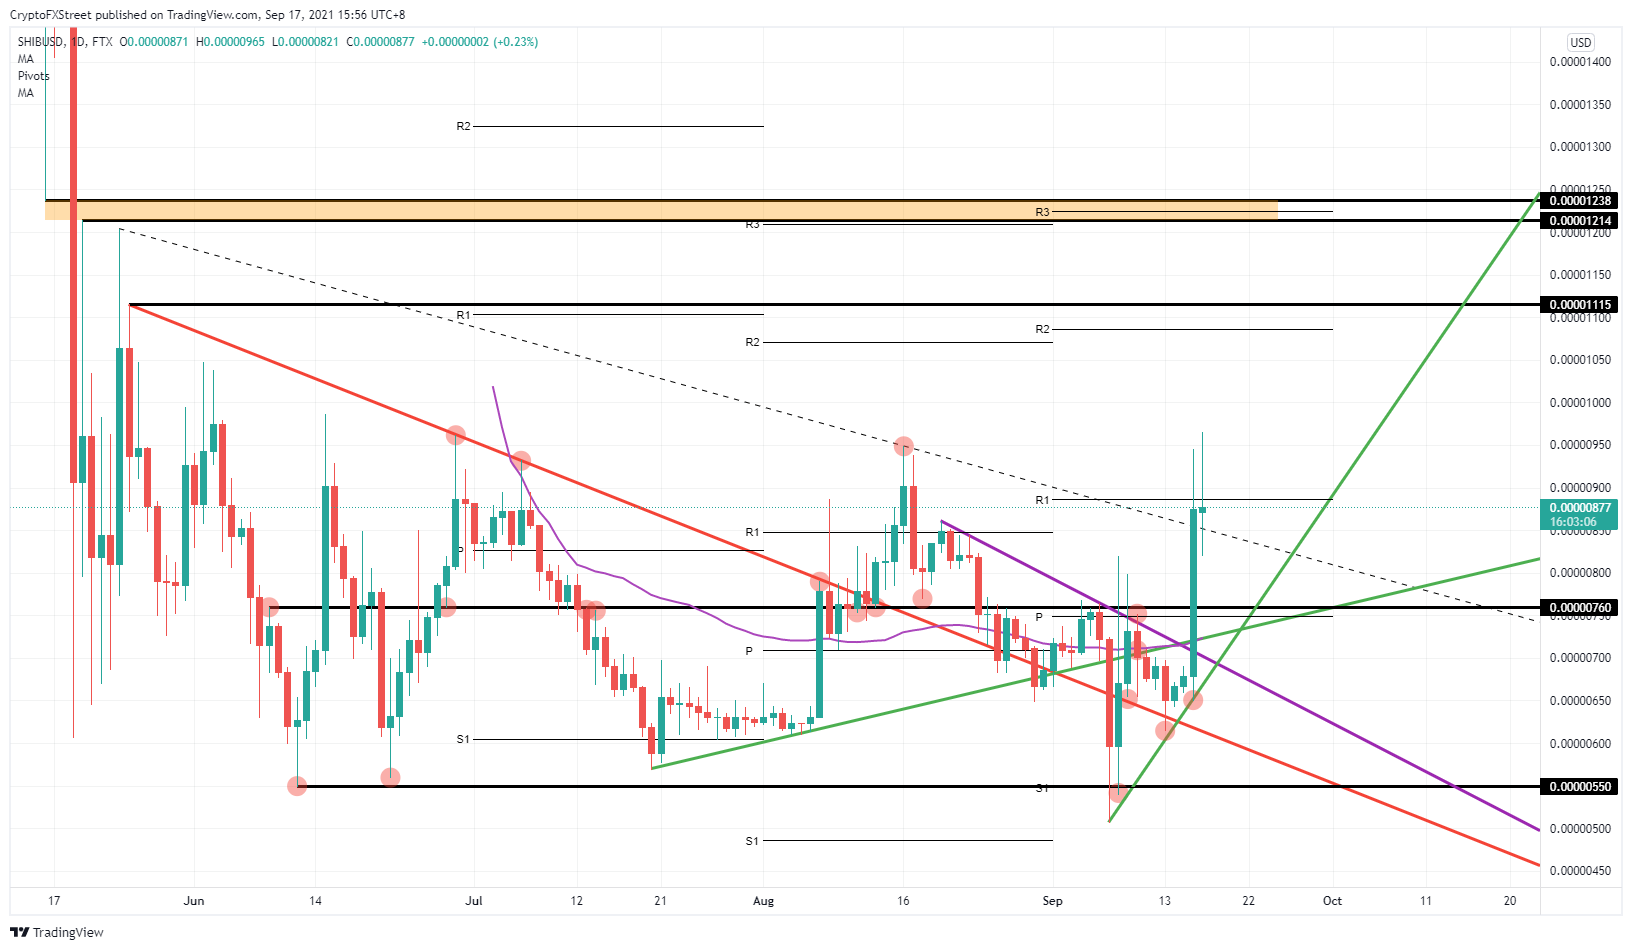
SHIB/USD daily chart
Once buyers are ramping up price action again in SHIB, expect a re-break of that double top that only holds intermediary importance. From there, not much in the way for another leg higher toward $0.00001110 to $0.00001115. Here Shiba Inu will start to show signs of the rally slowing down again, as this is both a historical zone and the monthly R2 resistance level will try to cap any further upside. The holy grail of profits for the bulls will await around $0.00001215. This region, however, will be the absolute stop as SHIB price action has two historical levels here and the monthly R3 resistance level is all but inches apart from them. Expect this region to be the ultimate stop for this rally, and sellers will then take over.
If the rally fades earlier, expect a retrace toward $0.00000760. That will still hold some importance as a baseline, and buyers will want to avoid falling back in the range trade where SHIB was stuck in for almost a whole month.
Author

Filip Lagaart
FXStreet
Filip Lagaart is a former sales/trader with over 15 years of financial markets expertise under its belt.


