- Shiba Inu price action sees volume wearing thinner due to investors remaining sidelined as peace talks in Ukraine stall.
- SHIB bulls are a bit puzzled about what to do next as global worries on inflation and Ukraine are dampening any upward potential in SHIB price action.
- Expect to see the price go sideways to lower today, heading into the weekend.
Shiba Inu (SHIB) price action has not been in a sweet spot for investors this week. With whipsawing price action and bears still sitting on lucrative gains, investors got burned several times on false breakouts and mixed signals coming from both the markets and price action in SHIB. Expect a large number of funds to stay sidelined as more peace talks get underway, but Russia’s stance of not wanting to meet Ukraine halfway, suggest those talks are likely to end in failure rather than success.
Shiba Inu price reveals that bulls are not taking chances as new peace talks have no chance of succeeding
Shiba Inu price action is on a slow downward burn after bulls got tempted in to what looked like a relief rally but instead turned out to be a full-fledged bull trap, squeezing bulls out of their positions, paring back all the gains accrued, and even making a new low for the week this morning. With the Relative Strength Index flatlining, it looks as if SHIB’s balance between bears and bulls is in gridlock as bulls do not want to engage without a clear positive catalyst, and bears are sitting on a pile of profits that they do not want to offload at the current levels. It will take either a breakthrough in peace talks or another catalyst to form some counterweight against the forecast of stagflation and further deterioration in Ukraine that is at the moment directing price action in Shiba Inu.
SHIB price will test the new lows for this week and looks set to drop to the green ascending trend line near $0.00002108, which falls roughly in line with the low of February 24. Depending on how the US dollar behaves, expect to see some movement to the upside, but nowhere near the high of yesterday, so relatively muted below $0.00002400. Expect SHIB price action to go into the weekend within that price range, awaiting any headlines that could set the tone for next week.
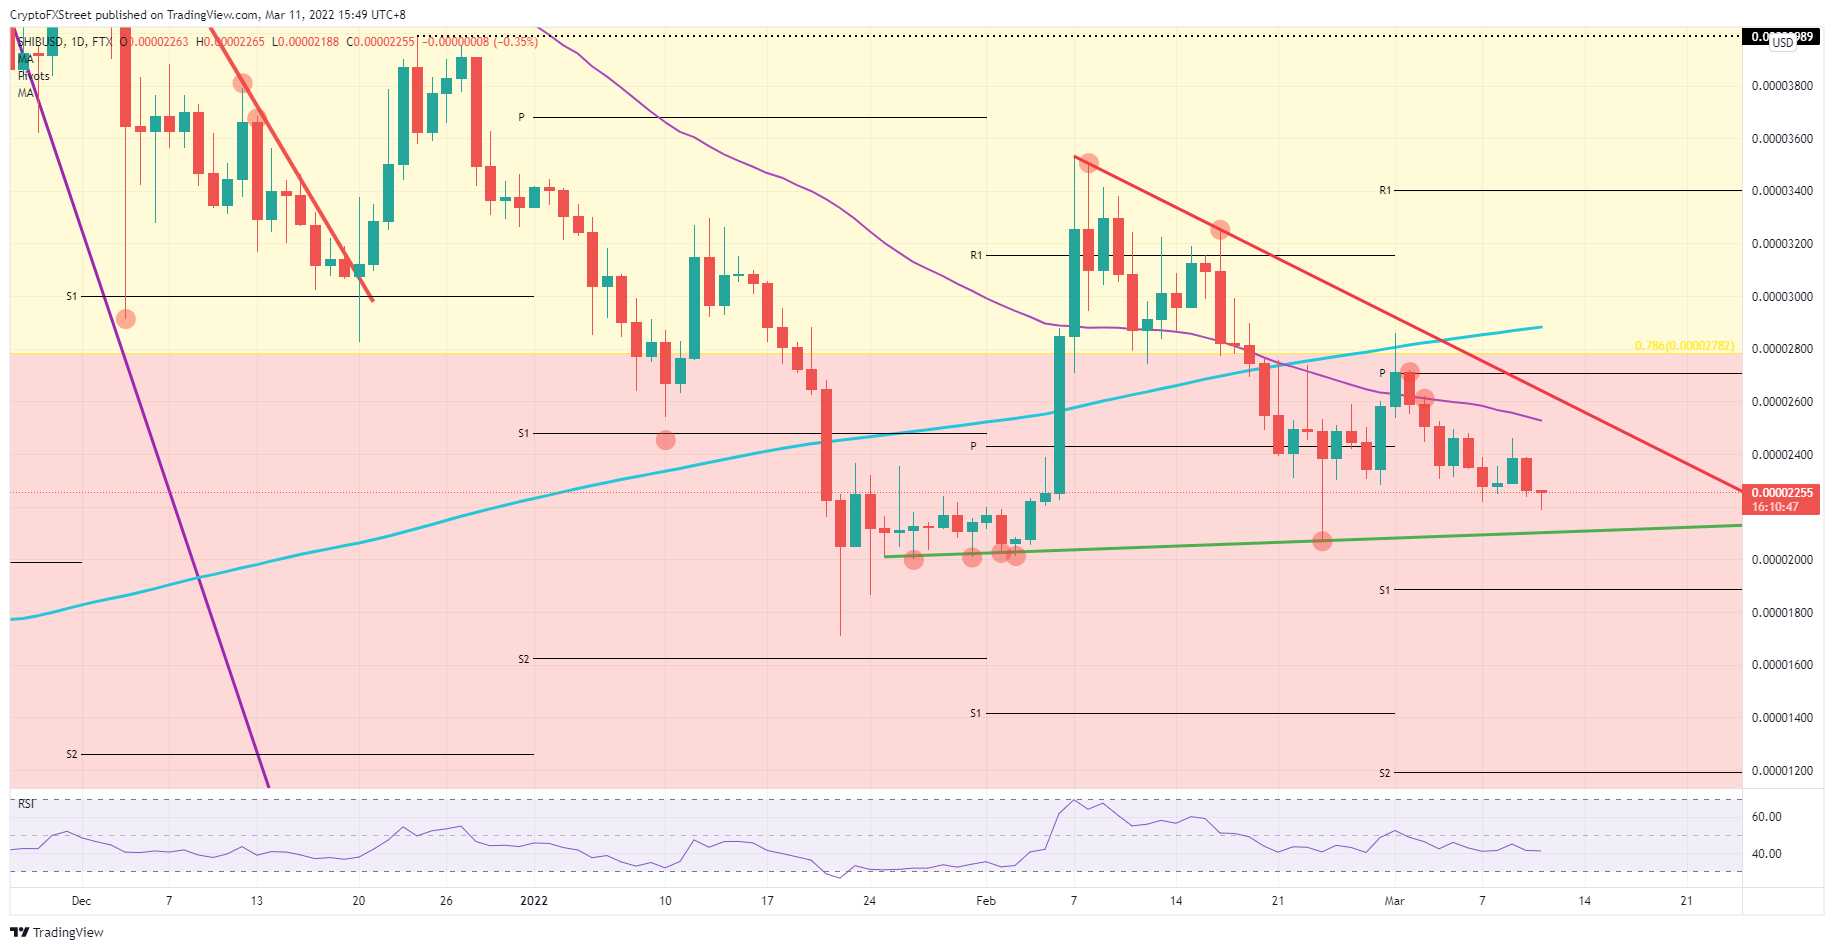
SHIB/USD daily chart
If a breakthrough is made on some front, or some economic data opens a window of relief, expect to see a pop above $0.00002400, breaking the high of yesterday and opening up more upside towards $0.00002533, which is the 55-day Simple Moving Average (SMA). SHIB price action would print a new high for the week with this. As the red descending trend line is in the near vicinity, expect possible bulls to try and reach out to that level, near $0.00002636, for a test and possible break to the upside if the positive sentiment only gains traction going into the weekend.
Information on these pages contains forward-looking statements that involve risks and uncertainties. Markets and instruments profiled on this page are for informational purposes only and should not in any way come across as a recommendation to buy or sell in these assets. You should do your own thorough research before making any investment decisions. FXStreet does not in any way guarantee that this information is free from mistakes, errors, or material misstatements. It also does not guarantee that this information is of a timely nature. Investing in Open Markets involves a great deal of risk, including the loss of all or a portion of your investment, as well as emotional distress. All risks, losses and costs associated with investing, including total loss of principal, are your responsibility. The views and opinions expressed in this article are those of the authors and do not necessarily reflect the official policy or position of FXStreet nor its advertisers. The author will not be held responsible for information that is found at the end of links posted on this page.
If not otherwise explicitly mentioned in the body of the article, at the time of writing, the author has no position in any stock mentioned in this article and no business relationship with any company mentioned. The author has not received compensation for writing this article, other than from FXStreet.
FXStreet and the author do not provide personalized recommendations. The author makes no representations as to the accuracy, completeness, or suitability of this information. FXStreet and the author will not be liable for any errors, omissions or any losses, injuries or damages arising from this information and its display or use. Errors and omissions excepted.
The author and FXStreet are not registered investment advisors and nothing in this article is intended to be investment advice.
Recommended Content
Editors’ Picks

Is Altcoin Season here as Bitcoin reaches a new all-time high?
Bitcoin reaches a new all-time high of $98,384 on Thursday, with altcoins following the suit. Reports highlight that the recent surge in altcoins was fueled by the victory of crypto-friendly candidate Donal Trump in the US presidential election.

Shanghai court confirms legal recognition of crypto ownership
A Shanghai court has confirmed that owning digital assets, including Bitcoin, is legal under Chinese law. Judge Sun Jie of the Shanghai Songjiang People’s Court shared this opinion through the WeChat account of the Shanghai High People’s Court.
BTC hits an all-time high above $97,850, inches away from the $100K mark
Bitcoin hit a new all-time high of $97,852 on Thursday, and the technical outlook suggests a possible continuation of the rally to $100,000. BTC futures have surged past the $100,000 price mark on Deribit, and Lookonchain data shows whales are accumulating.
Shiba Inu holders withdraw 1.67 trillion SHIB tokens from exchange
Shiba Inu trades slightly higher, around $0.000024, on Thursday after declining more than 5% the previous week. SHIB’s on-chain metrics project a bullish outlook as holders accumulate recent dips, and dormant wallets are on the move, all pointing to a recovery in the cards.
Bitcoin: New high of $100K or correction to $78K?
Bitcoin surged to a new all-time high of $93,265 in the first half of the week, followed by a slight decline in the latter half. Reports highlight that Bitcoin’s current level is still not overvalued and could target levels above $100,000 in the coming weeks.

Best Forex Brokers with Low Spreads
VERIFIED Low spreads are crucial for reducing trading costs. Explore top Forex brokers offering competitive spreads and high leverage. Compare options for EUR/USD, GBP/USD, USD/JPY, and Gold.