![]() Sheldon McIntyre, CMT
Sheldon McIntyre, CMT
Independent Analyst
- Shiba Inu price fails to participate in the crypto complex rally, remaining locked in the handle of the cup-with-handle base.
- SHIB continues to hold the 50-day simple moving average (SMA), thereby not voiding the base breakout.
- Shiba Inu price triggers a bullish Golden Cross pattern on the nine-hour chart, bolstering the layers of support.
Shiba Inu price formed a cup-with-handle base through July and early August before activating on August 16 with a daily close above the handle high of $0.00000887. However, the breakout was met with profit-taking, pushing SHIB back into the handle of the base and raising the possibility of a bull trap. While the breakout has not been voided, the potential for a run to the measured move target of $0.00001214 becomes dimmer with each day.
Shiba Inu price questions base legitimacy
On August 16, Shiba Inu price activated a constructive base after several weeks of indecisive action and complicated price structures. The breakout was met with a -10.75% reversal on August 17, marking the most significant daily decline since June 21. The pullback has put SHIB investors on the defensive with a double-digit loss from the handle high entry price and a possible bull trap.
The Shiba Inu price breakout on August 16 was accompanied by a bullish Golden Cross pattern on the nine-hour chart, indicating a turn in the price structure at a higher timeframe and creating a new source of momentum and support. However, it was overshadowed by a bearish momentum divergence on the nine-hour Relative Strength Index (RSI) and the resulting reversal.
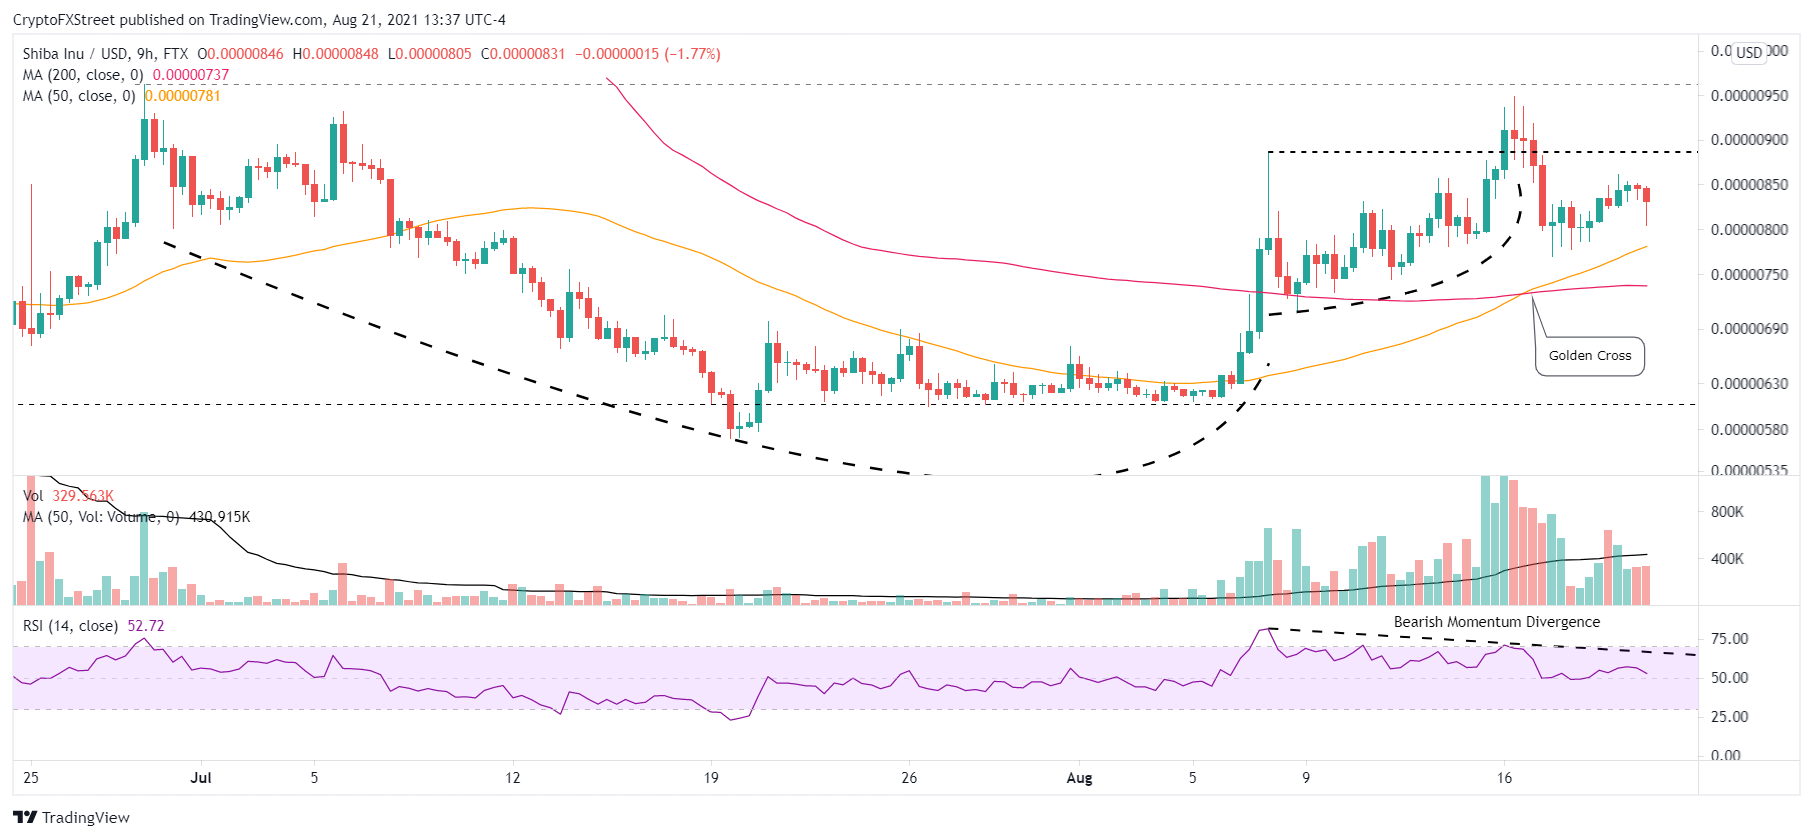
SHIB/USD 9-hour chart
The lack of conviction combined with the bearish momentum divergence and the -10.75% reversal have illuminated the importance of the support outlined by the flattening 50-day SMA at $0.00000728 and the handle low of $0.00000711. A drop below $0.00000711 would be a 14.54% decline from the current price.
A failure to draw support at the union of the two levels on a daily closing basis would instantly turn the Shiba Inu outlook bearish and expose SHIB to an immediate retracement to the governing support created by the May 19 low of $0.00000607. The $0.00000607 level was instrumental in halting the selling pressure during the June and July reversals.
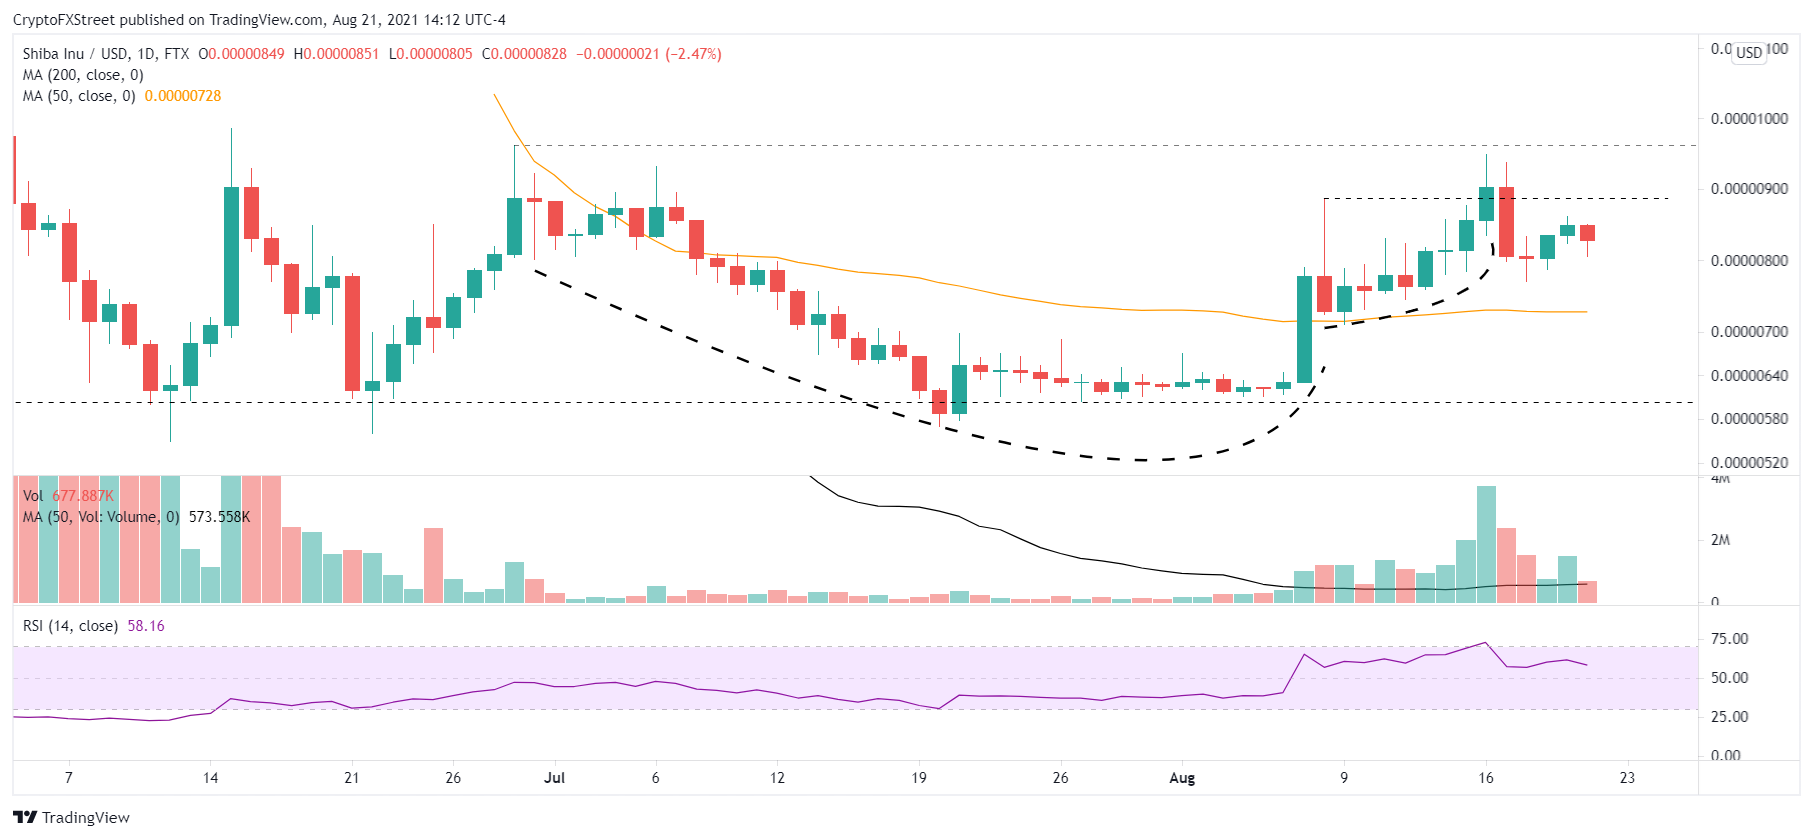
SHIB/USD daily chart
The immediate SHIB pullback on August 17 may have been a reaction to the overbought condition on the daily RSI, but the longer it persists, the greater the challenge to renew the breakout.
To reactivate the cup-with-handle base release, Shiba Inu price needs to log a daily close above the August 16 high of $0.00000949. Otherwise, SHIB speculators will remain locked in a directionless cryptocurrency, further undermining the base authority and the bullish narrative generated by the 23.30% spike from the May 19 low on August 7.
With Bitcoin and several altcoins printing new rally highs, the frustration grows for SHIB investors. It reflects the uneven performance that can occur in the cryptocurrency complex and the enduring challenges implicit in holding outlier cryptocurrencies. Therefore, it complicates the original bullish forecast of a move to $0.00001214 as the meme token loses its allure.
Here, FXStreet's analysts evaluate where SHIB could be heading next as it seems primed for a correction before another run-up.
Note: All information on this page is subject to change. The use of this website constitutes acceptance of our user agreement. Please read our privacy policy and legal disclaimer. Opinions expressed at FXstreet.com are those of the individual authors and do not necessarily represent the opinion of FXstreet.com or its management. Risk Disclosure: Trading foreign exchange on margin carries a high level of risk, and may not be suitable for all investors. The high degree of leverage can work against you as well as for you. Before deciding to invest in foreign exchange you should carefully consider your investment objectives, level of experience, and risk appetite. The possibility exists that you could sustain a loss of some or all of your initial investment and therefore you should not invest money that you cannot afford to lose. You should be aware of all the risks associated with foreign exchange trading, and seek advice from an independent financial advisor if you have any doubts.
Recommended Content
Editors’ Picks

XRP chart signals 27% jump after SEC-Ripple appeals pause and $50 million settlement
Ripple (XRP) stabilized above $2.00 exemplifying a similar pattern to the largest cryptocurrency by market capitalization, Bitcoin (BTC), which holds firmly above $84,000 at the time of writing on Thursday.

Bitwise lists four crypto ETPs on London Stock Exchange
Bitwise announced on Wednesday that it had listed four of its Germany-issued crypto Exchange-Traded products (ETPs) on the London Stock Exchange. It aims to expand access to its products for Bitcoin (BTC) and Ethereum (ETH) investors and widen its footprint across European markets.

RAY sees double-digit gains as Raydium unveils new Pumpfun competitor
RAY surged 10% on Wednesday as Raydium revealed its new meme coin launchpad, LaunchLab, a potential competitor to Pump.fun — which also recently unveiled its decentralized exchange (DEX) PumpSwap.

Ethereum Price Forecast: ETH face value- accrual risks due to data availability roadmap
Ethereum (ETH) declined 1%, trading just below $1,600 in the early Asian session on Thursday, as Binance Research's latest report suggests that the data availability roadmap has been hampering its value accrual.

Bitcoin Weekly Forecast: Market uncertainty lingers, Trump’s 90-day tariff pause sparks modest recovery
Bitcoin (BTC) price extends recovery to around $82,500 on Friday after dumping to a new year-to-date low of $74,508 to start the week. Market uncertainty remains high, leading to a massive shakeout, with total liquidations hitting $2.18 billion across crypto markets.

The Best brokers to trade EUR/USD
SPONSORED Discover the top brokers for trading EUR/USD in 2025. Our list features brokers with competitive spreads, fast execution, and powerful platforms. Whether you're a beginner or an expert, find the right partner to navigate the dynamic Forex market.