![]() Sheldon McIntyre, CMT
Sheldon McIntyre, CMT
Independent Analyst
- Shiba Inu price is drifting lower along the 50 four-hour simple moving average (SMA).
- SHIB symmetrical triangle breakout on May 24 remains live, despite minor pullback.
- Consecutive inside days raise the probability of a significant range expansion in the coming hours.
Shiba Inu price has drifted downwards since the May 24 breakout, finding support at the symmetrical triangle’s upper trend line and resistance at the 50 four-hour SMA. A four-hour close above the moving average should ignite a new rally of at least 50% from price at the time of writing.
Shiba Inu price contraction leads to price expansion
The symmetrical triangle pattern, sometimes referred to as a coil, tends to form during a trend as a continuation pattern. The work by Edwards and Magee, “Technical Analysis of Stock Trends” (1948), suggests that 75% of symmetrical triangles are continuation patterns and the remaining are reversals. The reversal patterns are challenging to analyze and frequently have false breakouts.
From May 19 until May 24, Shiba Inu price created a symmetrical triangle pattern with two reaction highs and three reaction lows and a measured move target of $0.00001450, or a gain of 50%.
The May 24 breakout to the upside went against historical precedent, but it has not failed as SHIB remains above the triangle’s upper trend line and well above the triangle’s lower trend line.
Shiba Inu price rests at the 50 four-hour moving average and below the declining trend line from the May high. A four-hour close above the two points of resistance will enable SHIB to gain price traction and rally towards the original measured move target of $0.00001450. It would be more than a 50% gain from price at the time of writing.
The rally will encounter resistance at the May 24 high at $0.00001204, the May 16 low at $0.00001238 and the 23.6% Fibonacci retracement of the decline beginning on May 10 at $0.00001325.
If the cryptocurrency complex continues to rebound and FOMO seizes Shiba Inu price, SHIB could reach the 38.2% retracement at $0.00001793.
It is essential not to overlook the consecutive inside days on the bar chart. An important quote to keep in mind when evaluating price action is that “price contraction leads to price expansion.”
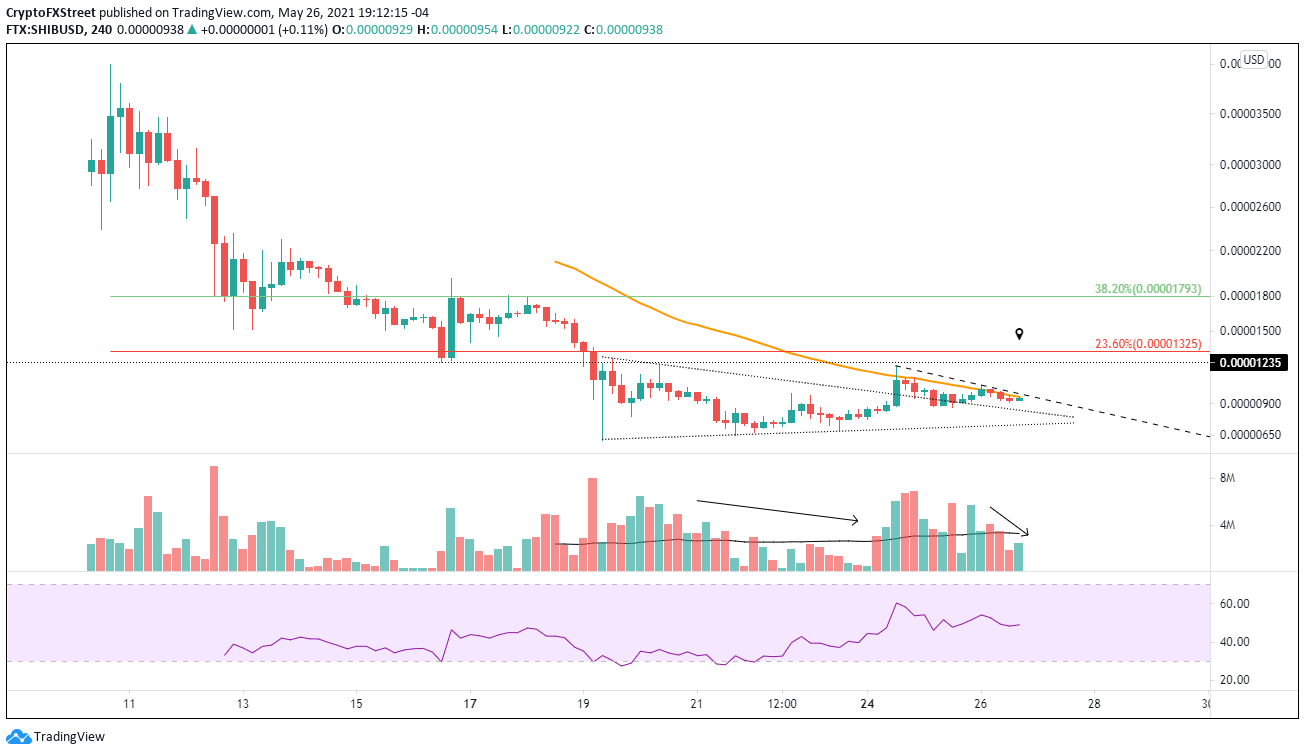
SHIB/USD 4-hour chart
A decline below the triangle’s lower trend line, currently at $0.00000722, would signal the end of the rally attempt and introduce a bearish narrative for Shiba Inu price. A decline below the May 19 at $0.00000607 would confirm the negative outlook.
Note: All information on this page is subject to change. The use of this website constitutes acceptance of our user agreement. Please read our privacy policy and legal disclaimer. Opinions expressed at FXstreet.com are those of the individual authors and do not necessarily represent the opinion of FXstreet.com or its management. Risk Disclosure: Trading foreign exchange on margin carries a high level of risk, and may not be suitable for all investors. The high degree of leverage can work against you as well as for you. Before deciding to invest in foreign exchange you should carefully consider your investment objectives, level of experience, and risk appetite. The possibility exists that you could sustain a loss of some or all of your initial investment and therefore you should not invest money that you cannot afford to lose. You should be aware of all the risks associated with foreign exchange trading, and seek advice from an independent financial advisor if you have any doubts.
Recommended Content
Editors’ Picks

Bitcoin Weekly Forecast: BTC nosedives below $95,000 as spot ETFs record highest daily outflow since launch
Bitcoin price continues to edge down, trading below $95,000 on Friday after declining more than 9% this week. Bitcoin US spot ETFs recorded the highest single-day outflow on Thursday since their launch in January.

Bitcoin crashes to $96,000, altcoins bleed: Top trades for sidelined buyers
Bitcoin (BTC) slipped under the $100,000 milestone and touched the $96,000 level briefly on Friday, a sharp decline that has also hit hard prices of other altcoins and particularly meme coins.

Solana Price Forecast: SOL’s technical outlook and on-chain metrics hint at a double-digit correction
Solana (SOL) price trades in red below $194 on Friday after declining more than 13% this week. The recent downturn has led to $38 million in total liquidations, with over $33 million coming from long positions.

SEC approves Hashdex and Franklin Templeton's combined Bitcoin and Ethereum crypto index ETFs
The SEC approved Hashdex's proposal for a crypto index ETF. The ETF currently features Bitcoin and Ethereum, with possible additions in the future. The agency also approved Franklin Templeton's amendment to its Cboe BZX for a crypto index ETF.

Bitcoin: 2025 outlook brightens on expectations of US pro-crypto policy
Bitcoin (BTC) price has surged more than 140% in 2024, reaching the $100K milestone in early December. The rally was driven by the launch of Bitcoin Spot Exchange Traded Funds (ETFs) in January and the reduced supply following the fourth halving event in April.

Best Forex Brokers with Low Spreads
VERIFIED Low spreads are crucial for reducing trading costs. Explore top Forex brokers offering competitive spreads and high leverage. Compare options for EUR/USD, GBP/USD, USD/JPY, and Gold.