![]() Sheldon McIntyre, CMT
Sheldon McIntyre, CMT
Independent Analyst
- Shiba Inu price releases from a cup completion cheat base on the four-hour chart, but the advance is short-lived.
- 50 four-hour simple moving average (SMA) has turned higher, adding credible support to balance any volatility.
- SHIB prone to quick bursts with no follow-through, challenging bullish investor conviction.
Shiba Inu price sketched out a cup completion cheat base from May 24 to June 2 with a pivot of $0.00000995, triggering yesterday. It was a short, four-hour burst that has since settled below the pivot. The minor new uptrend and a rising 50 four-hour SMA improve the probabilities that SHIB will reach pertinent price targets moving forward.
Shiba Inu price fades keep investors honest
From May 19 until May 24, Shiba Inu price formed a symmetrical triangle pattern with two reaction highs and three reaction lows with a measured move target of $0.00001450, representing a 50% gain. During the development of the triangle, SHIB closed with consecutive inside days.
On May 24, Shiba Inu price executed an impulsive breakout from the symmetrical triangle pattern, generating a 30% gain. Still, SHIB failed to capitalize and quickly fell into a downward drift, highlighted by resistance at the 10-day SMA and support at the triangle’s upper trend line.
During the May 28-30 period, Shiba Inu price balanced along the apex level of the symmetrical triangle, registering another inside day on May 30, leading to an eight-hour price burst that was quickly faded.
It has been notable that since the May 21 low, most of the price progress has been contained to four-hour bursts that are partially faded. The SHIB price action has kept investors honest with their trading tactics and forced a heightened level of patience.
Yesterday, Shiba Inu price released from a cup completion cheat pattern with a double-digit gain, but it failed to stick above the pivot. A cup completion cheat occurs when a handle-like consolidation forms in the lower half or even the lower third of an emerging cup. It offers an early entry point, and it is optimal to initiate with a pilot buy.
The measured move target of the base is $0.00001363, representing a 37% gain from the high of the cheat area. The target is calculated by taking the distance from the base low to the cheat area high and adding it to the cheat area high.
To reach the stated target, Shiba Inu price will struggle with a price range defined by the May 24 high at $0.00001204, the May 20 high at $0.00001214 and the May 16 low at $0.00001238, yielding a 20% return from the cheat pivot.
The only other relevant resistance is the 23.6% Fibonacci level of the May correction at $0.00001325.
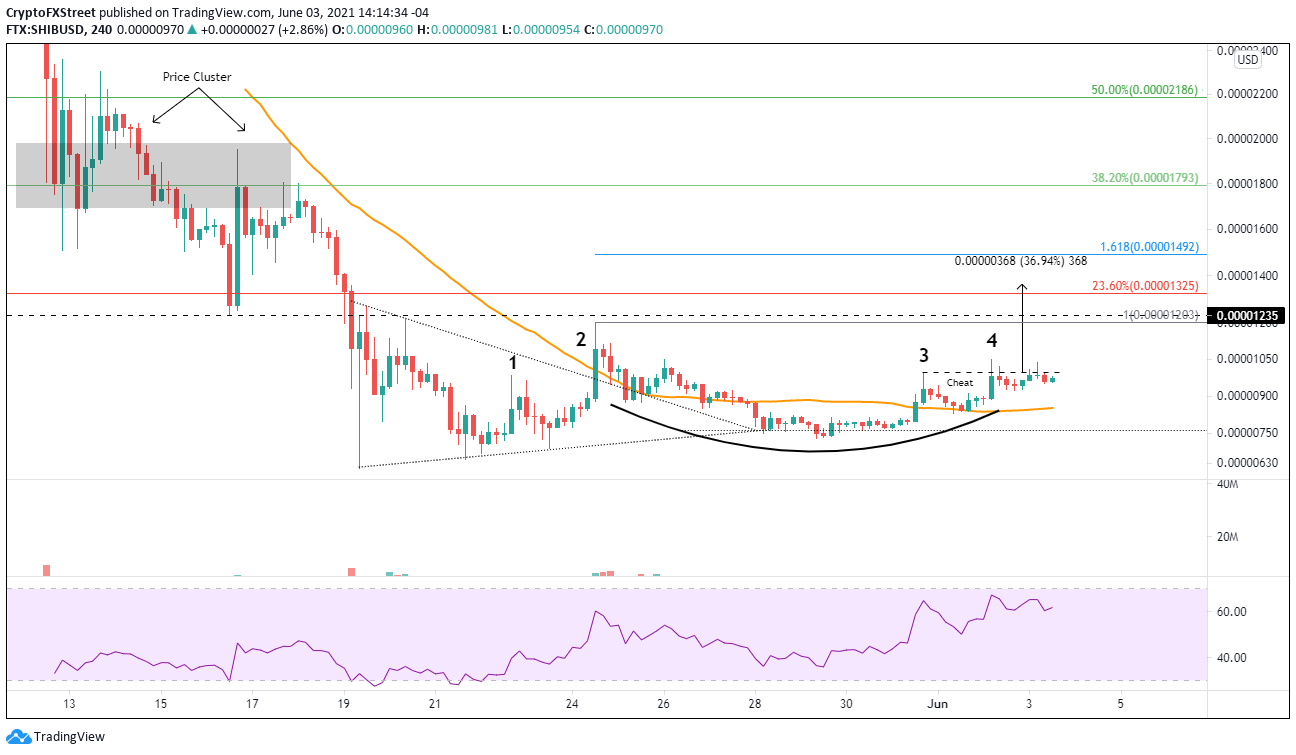
SHIB/USD 4-hour chart
SHIB support begins at the junction of the 50 four-hour SMA at $0.00000851, with the cheat area low at $0.00000830. Any further weakness should raise concern and prompt investors to trim positions or fully liquidate.
If historical precedent holds, SHIB investors should be prepared for short bursts matched with some price fade, thus requiring patience. However, the overall trend should remain tilted upwards for the foreseeable future. As a caveat, no cryptocurrency will escape the force of another heavy sell-off in the complex.
Note: All information on this page is subject to change. The use of this website constitutes acceptance of our user agreement. Please read our privacy policy and legal disclaimer. Opinions expressed at FXstreet.com are those of the individual authors and do not necessarily represent the opinion of FXstreet.com or its management. Risk Disclosure: Trading foreign exchange on margin carries a high level of risk, and may not be suitable for all investors. The high degree of leverage can work against you as well as for you. Before deciding to invest in foreign exchange you should carefully consider your investment objectives, level of experience, and risk appetite. The possibility exists that you could sustain a loss of some or all of your initial investment and therefore you should not invest money that you cannot afford to lose. You should be aware of all the risks associated with foreign exchange trading, and seek advice from an independent financial advisor if you have any doubts.
Recommended Content
Editors’ Picks

IRS says crypto staking should be taxed in response to lawsuit
The IRS stated that rewards from cryptocurrency staking are taxable upon receipt, according to a Bloomberg report on Monday, which stated the agency rejected a legal argument that sought to delay taxation until such rewards are sold or exchanged.

Solana dominates Bitcoin, Ethereum in price performance and trading volume: Glassnode
Solana is up 6% on Monday following a Glassnode report indicating that SOL has seen more capital increase than Bitcoin and Ethereum. Despite the large gains suggesting a relatively heated market, SOL could still stretch its growth before establishing a top for the cycle.

Ethereum Price Forecast: ETH risks a decline to $3,000 as investors realize increased profits and losses
Ethereum is up 4% on Monday despite increased selling pressure across long-term and short-term holders in the past two days. If whales fail to maintain their recent buy-the-dip attitude, ETH risks a decline below $3,000.

Crypto Today: BTC hits new Trump-era low as Chainlink, HBAR and AAVE lead market recovery
The global cryptocurrency market cap shrank by $500 billion after the Federal Reserve's hawkish statements on December 17. Amid the market crash, Bitcoin price declined 7.2% last week, recording its first weekly timeframe loss since Donald Trump’s re-election.

Bitcoin: 2025 outlook brightens on expectations of US pro-crypto policy
Bitcoin price has surged more than 140% in 2024, reaching the $100K milestone in early December. The rally was driven by the launch of Bitcoin Spot ETFs in January and the reduced supply following the fourth halving event in April.

Best Forex Brokers with Low Spreads
VERIFIED Low spreads are crucial for reducing trading costs. Explore top Forex brokers offering competitive spreads and high leverage. Compare options for EUR/USD, GBP/USD, USD/JPY, and Gold.