Shiba Inu Price Forecast: SHIB faces downside pressure as it dips below key support
- Shiba Inu price nearly broke through the barrier that could have triggered a 34% rally but failed to sustain the bullish momentum.
- The meme coin posted a double bottom or ‘W’ pattern on the weekly time frame, suggesting a bullish Q1.
- SHIB is presently trading below $0.0000100, but is still far away from the bullish invalidation level of $0.00000944.

Shiba Inu’s (SHIB) price took a surprising route in the first trading days of 2024, defying expectations of a bullish start to the year. Not only has it dipped on the charts, but the meme coin has also nearly invalidated a major bullish reversal technical pattern, increasing concerns of further downside ahead for the investors of this cryptocurrency.
Shiba Inu fails to follow bullish pattern
Shiba Inu price fell by nearly 5% on Friday on the weekly chart after the crypto market took a hit following the Matrixport report that said the US Securities and Exchange Commission (SEC) would reject the applications of spot Bitcoin ETFs. In doing so, the altcoin fell through a crucial support level of $0.0000102 to trade at $0.0000098 at the time of writing.
The reason why this price point is important for the meme coin is that it forms the neckline of the double bottom technical pattern, or the ‘W’ pattern, observed on the weekly chart. Known to be a bullish reversal pattern, it is formed when an asset hits two distinct lows at the same level on separate trading sessions.
The level to which the price falls twice is considered the support level. In the case of SHIB, this support level is marked at $0.0000066, from which the altcoin has bounced back at the beginning of June and again in the last week of October.
When inferring this pattern, the target is calculated by looking at the height of the double bottom pattern. A similar increase above the breakout level, also known as neckline, is the projected growth. The breakout level for Shiba Inu is marked at $0.0000098, and the height of the pattern places the target at $0.0000138, almost 35% above the breakout level.
Shiba Inu price was on track to achieve this, but the dip this week resulted in the meme coin falling through the neckline. However, the bullish reversal pattern has not been completely invalidated as the stop loss is set at $0.0000094.
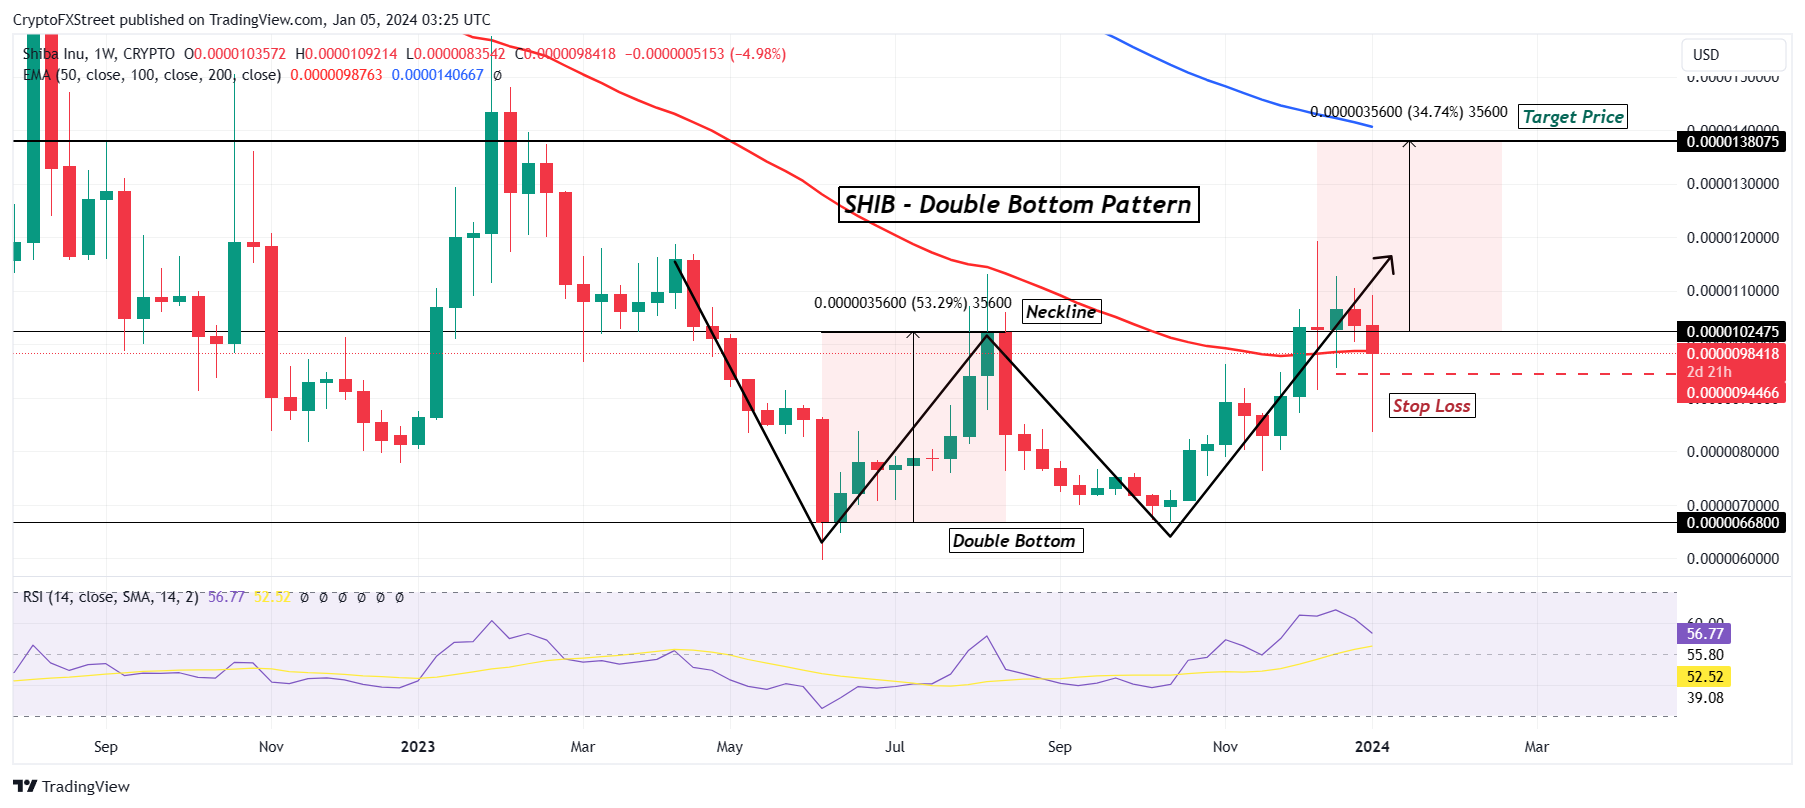
SHIB/USD 1-week chart
If SHIB falls through the stop loss too, the pattern would be invalidated, and investors could observe a decline to $0.0000080 or lower.
But if the broader market cues pull the meme coin back up and Shiba Inu price breaches the entry point marked at the neckline, it could have another shot at achieving the 35% rally towards the measured target.
Author

Aaryamann Shrivastava
FXStreet
Aaryamann Shrivastava is a Cryptocurrency journalist and market analyst with over 1,000 articles under his name. Graduated with an Honours in Journalism, he has been part of the crypto industry for more than a year now.


