Shiba Inu price eyes 23% gain as SHIB coils up
- Shiba Inu price has been consolidating for roughly eleven days, suggesting a lack of volatility.
- Due to the coil up, investors can expect SHIB to witness a 23% ascent that could retest the 200-day SMA at $0.0000254.
- A breakdown of the $0.0000158 support level will invalidate the bullish thesis.
Shiba Inu price witnessed a massive sell-off as the crypto markets descended into chaos between January 20 and January 22. While many altcoins have recovered SHIB seems to be coiling up, hinting at a breakout move.
Shiba Inu price heats up
Shiba Inu price dropped 36% between January 21 and January 22, dipping its toes into the daily demand zone, extending from $0.0000158 to $0.0000193. As a result, SHIB recovered just above the said barrier and started coiling up.
Even after ten days of consolidation, SHIB seems to be showing no signs of a breakout. However, when it does, investors can expect the meme coin to make a 23% run for the immediate resistance barrier at $0.0000254 aka the 200-day Simple Moving Average (SMA).
In some cases, although unlikely, Shiba Inu price could extend beyond this barrier and retest the weekly resistance level at $0.0000283, roughly coinciding with the 50-day SMA. This move would bring the total gain from 23% to 36%.
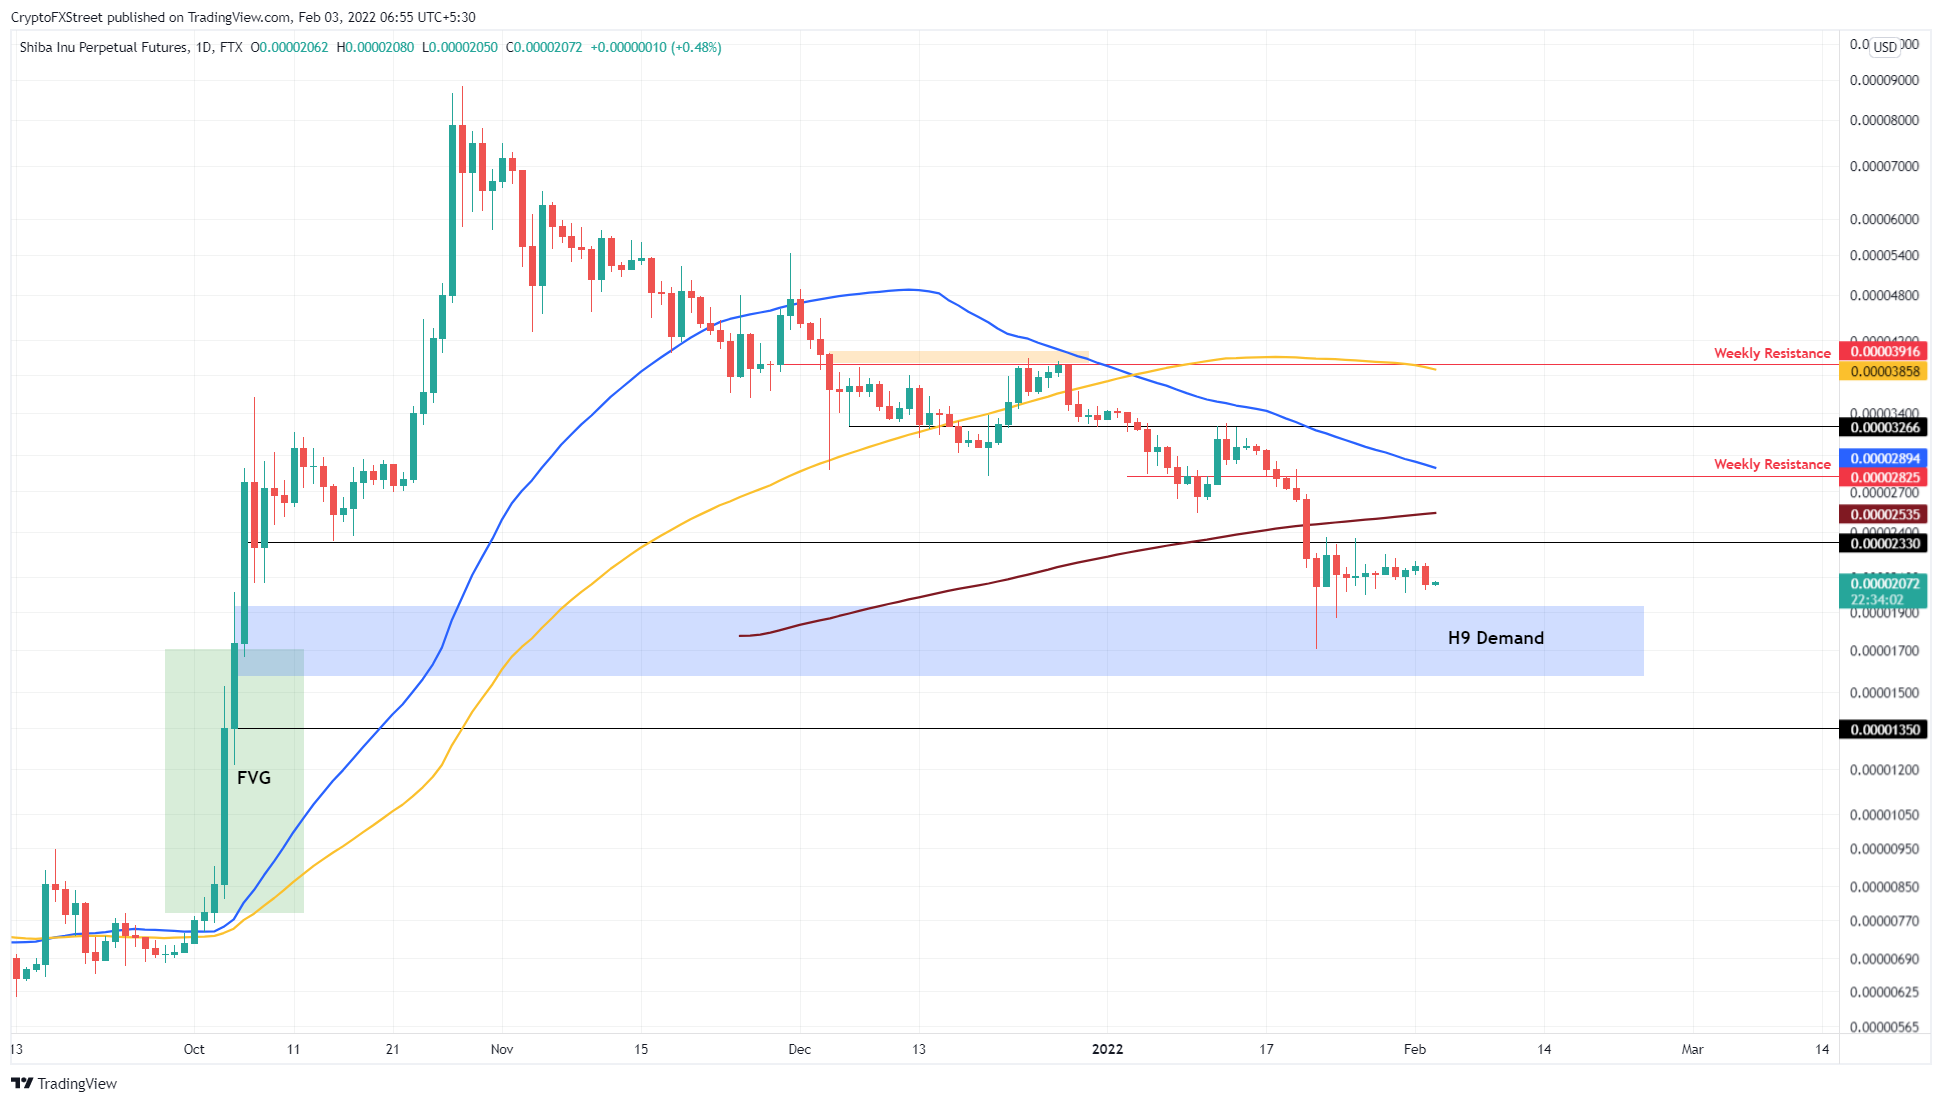
SHIB/USDT 1-day chart
While things are looking up for Shiba Inu price from a technical perspective, a breakdown could result in the retest of the $0.0000158 to $0.0000193 demand zone. Here, buyers have another chance at an uptrend, but failing to pull through could likely result in a daily candlestick close below from $0.0000158, which will produce a lower low, invalidating the bullish thesis.
This development could see Shiba Inu price retest the $0.0000135 support level, where bulls can band together for another upswing.
Author

Akash Girimath
FXStreet
Akash Girimath is a Mechanical Engineer interested in the chaos of the financial markets. Trying to make sense of this convoluted yet fascinating space, he switched his engineering job to become a crypto reporter and analyst.


