- Shiba Inu price action is still trading in the broader term triangle with support at $0.00002100 and $0.00002700 to the topside.
- SHIB price performs knee-jerk recovery as positive peace talks between Russia and Ukraine set a tone of hope and relief.
- Expect to see short-term returns to $0.00002400, with an upside target at $0.00002600, holding 11% gains.
Shiba Inu (SHIB) price action was on the back foot these past few days with some firm rejections last week at the monthly pivot and the 55-day Simple Moving Average (SMA) – providing bears with two entry points . Add to that equation a stronger dollar as a safe-haven, and SHIB price was under double pressure from two bearish forces. With the announcement of the third round of peace talks, markets are optimistic and triggering a relief rally that could tick $0.00002400 intraday, and could even go all the way to $0.00002700 should further relief signals emerge from global markets.
Shiba Inu price looks ready to jump
Shiba Inu price action is rallying into the European session after announcing that Ukraine and Russia are entering the third round of peace talks, and human corridors will be installed throughout Tuesday. Bulls use these headlines for diving into the price action and using the low of February 28 at $0.00002280 as an entry point. The bull army is being reflected in the Relative Strength Index’s knee-jerk reaction higher as the RSI shifts back up towards 50 but is still ultimately subdued at the moment.
SHIB price looks set to take out yesterday's high and try to tick $0.00002400. Key will be to see where the daily close ends up and how sticky positive headlines prove to be. Going into the U.S. session and tomorrow’s ASIA PAC price needs to stay above $0.00002400 to relay to traders that the rally is viable. Expect to see more inflows tomorrow with SHIB set to tick either $0.00002600 at the 55-day SMA or around the monthly pivot at $0.00002700.
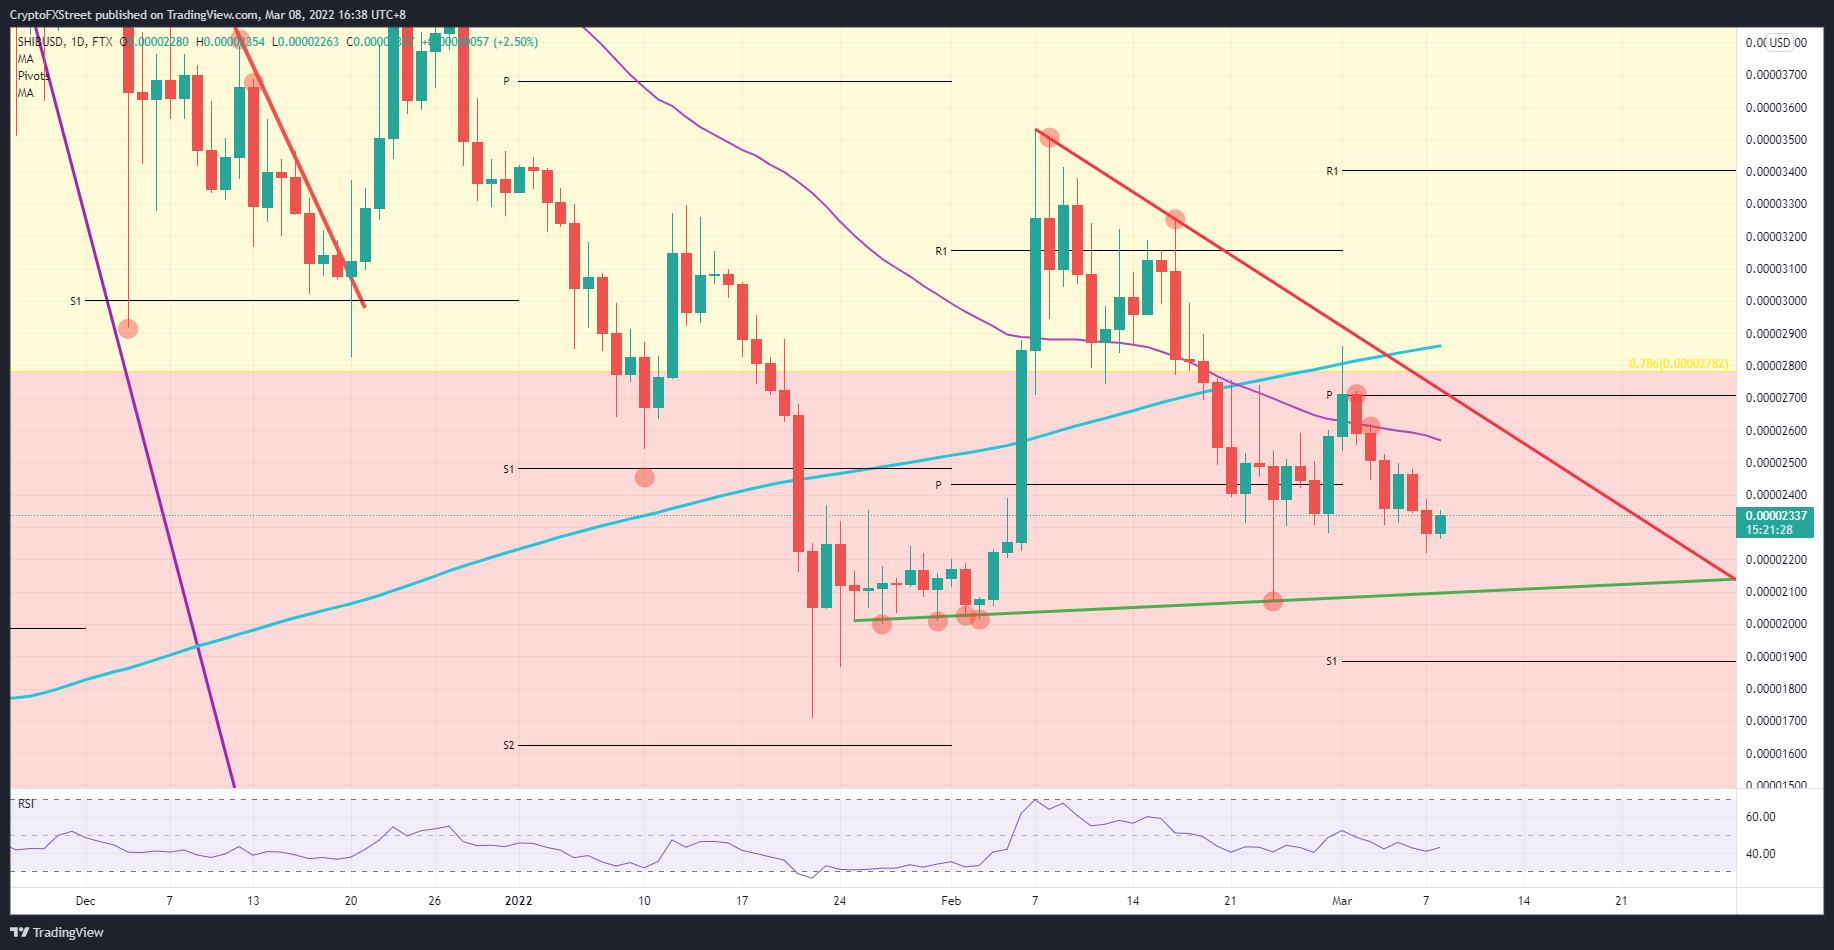
SHIB/USD daily chart
This rally hangs on the lips of any new headlines coming out and hitting the wires. A negative headline could easily trip it up and see bulls falling flat on their belly against the opening price at $0.00002280. Other negative headlines could quickly accelerate the drop towards the green baseline of the triangle, taking out $0.00002200 to the downside and looking for support at $0.00002100. Although negative, the loss would be pretty contained, amounting to an 8% or 9% loss against today's opening price.
Information on these pages contains forward-looking statements that involve risks and uncertainties. Markets and instruments profiled on this page are for informational purposes only and should not in any way come across as a recommendation to buy or sell in these assets. You should do your own thorough research before making any investment decisions. FXStreet does not in any way guarantee that this information is free from mistakes, errors, or material misstatements. It also does not guarantee that this information is of a timely nature. Investing in Open Markets involves a great deal of risk, including the loss of all or a portion of your investment, as well as emotional distress. All risks, losses and costs associated with investing, including total loss of principal, are your responsibility. The views and opinions expressed in this article are those of the authors and do not necessarily reflect the official policy or position of FXStreet nor its advertisers. The author will not be held responsible for information that is found at the end of links posted on this page.
If not otherwise explicitly mentioned in the body of the article, at the time of writing, the author has no position in any stock mentioned in this article and no business relationship with any company mentioned. The author has not received compensation for writing this article, other than from FXStreet.
FXStreet and the author do not provide personalized recommendations. The author makes no representations as to the accuracy, completeness, or suitability of this information. FXStreet and the author will not be liable for any errors, omissions or any losses, injuries or damages arising from this information and its display or use. Errors and omissions excepted.
The author and FXStreet are not registered investment advisors and nothing in this article is intended to be investment advice.
Recommended Content
Editors’ Picks

Crypto fraud soars as high-risk addresses on Ethereum, TRON networks receive $278 billion
The cryptocurrency industry is growing across multiple facets, including tokenized real-world assets, futures and spot ETFs, stablecoins, Artificial Intelligence (AI), and its convergence with blockchain technology, as well as the dynamic decentralized finance (DeFi) sector.

Bitcoin eyes $100,000 amid Arizona Reserve plans, corporate demand, ETF inflows
Bitcoin price is stabilizing around $95,000 at the time of writing on Tuesday, and a breakout suggests a rally toward $100,000. The institutional and corporate demand supports a bullish thesis, as US spot ETFs recorded an inflow of $591.29 million on Monday, continuing the trend since April 17.

Meme coins to watch as Bitcoin price steadies
Bitcoin price hovers around $95,000, supported by continued spot BTC ETFs’ inflows. Trump Official is a key meme coin to watch ahead of a stakeholder dinner to be attended by President Donald Trump. Dogwifhat price is up 47% in April and looks set to post its first positive monthly returns this year.

Cardano Lace Wallet integrates Bitcoin, boosting cross-chain capabilities
Cardano co-founder Charles Hoskinson announced Monday that Bitcoin is integrated into the Lace Wallet, expanding Cardano’s ecosystem and cross-chain capabilities. This integration enables users to manage BTC alongside Cardano assets, providing support for multichain functionality.
Bitcoin Weekly Forecast: BTC consolidates after posting over 10% weekly surge
Bitcoin (BTC) price is consolidating around $94,000 at the time of writing on Friday, holding onto the recent 10% increase seen earlier this week.

The Best brokers to trade EUR/USD
SPONSORED Discover the top brokers for trading EUR/USD in 2025. Our list features brokers with competitive spreads, fast execution, and powerful platforms. Whether you're a beginner or an expert, find the right partner to navigate the dynamic Forex market.