![]() Sheldon McIntyre, CMT
Sheldon McIntyre, CMT
Independent Analyst
- Shiba Inu steadies along the apex level of a symmetrical triangle pattern.
- Four inside days over the last eight trading days have not generated a sustainable SHIB range expansion.
- A daily close above the 10-day simple moving average (SMA), confirms a new rally for the meme token.
Shiba Inu price stabilization at the apex level of a symmetrical triangle is a bullish development for the briefly traded SHIB. Still, the digital asset may require a catalyst, external or organic, to facilitate a range expansion that overcomes resistance at the 10-day SMA.
Shiba Inu price searching for a large, loud and funny community
From May 19 until May 24, Shiba Inu price created a symmetrical triangle pattern with two reaction highs and three reaction lows and a measured move target of $0.00001450, representing a gain of 50%.
Shiba Inu price delivered an impulsive move from the symmetrical triangle pattern on May 24 with a 30% gain, but SHIB failed to capitalize on the breakout and quickly slipped in a downward drift, highlighted by resistance at the 10-day SMA and support at the triangle’s upper trend line.
Over the last three days, Shiba Inu price has balanced along the apex level of a symmetrical triangle around $0.00000762. The horizontal price action has created an inverse head-and-shoulders pattern on the 1-hour chart with a trigger price of $0.000000807.
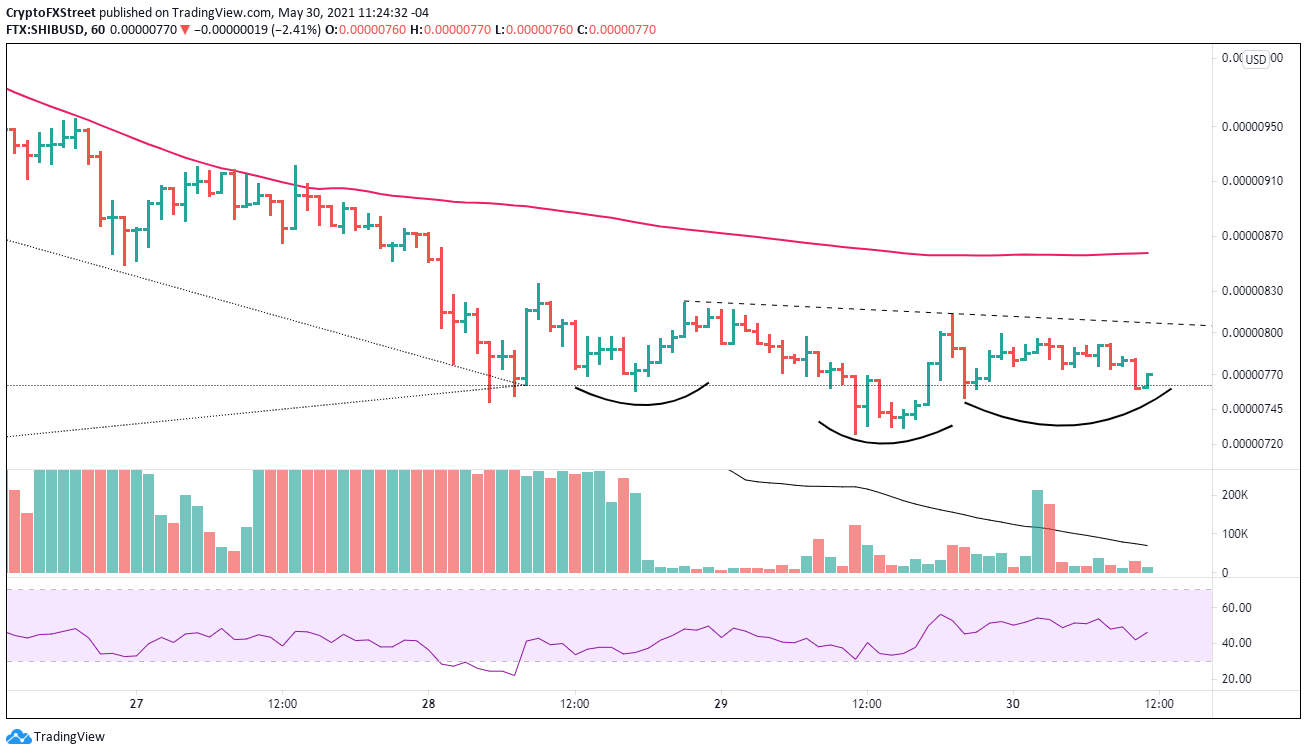
SHIB/USD 1-hour chart
A daily close above the 10-day SMA at $0.00000864 will be confirmation of a new SHIB rally.
A new Shiba Inu price rally will not encounter resistance until the price range defined by the May 24 high at $0.00001204, the May 20 high at $0.00001214 and the May 16 low at $0.00001238. If SHIB decisively breaks through the range, it should quickly test the 23.6% Fibonacci retracement of the decline from the May 10 high at $0.00001325.
The 38.2% retracement level at $0.00001793 will be a more difficult challenge as it aligns with a price cluster from May 12 to May 18. Ambitious SHIB investors will be targeting the 50% retracement at $0.00002186.
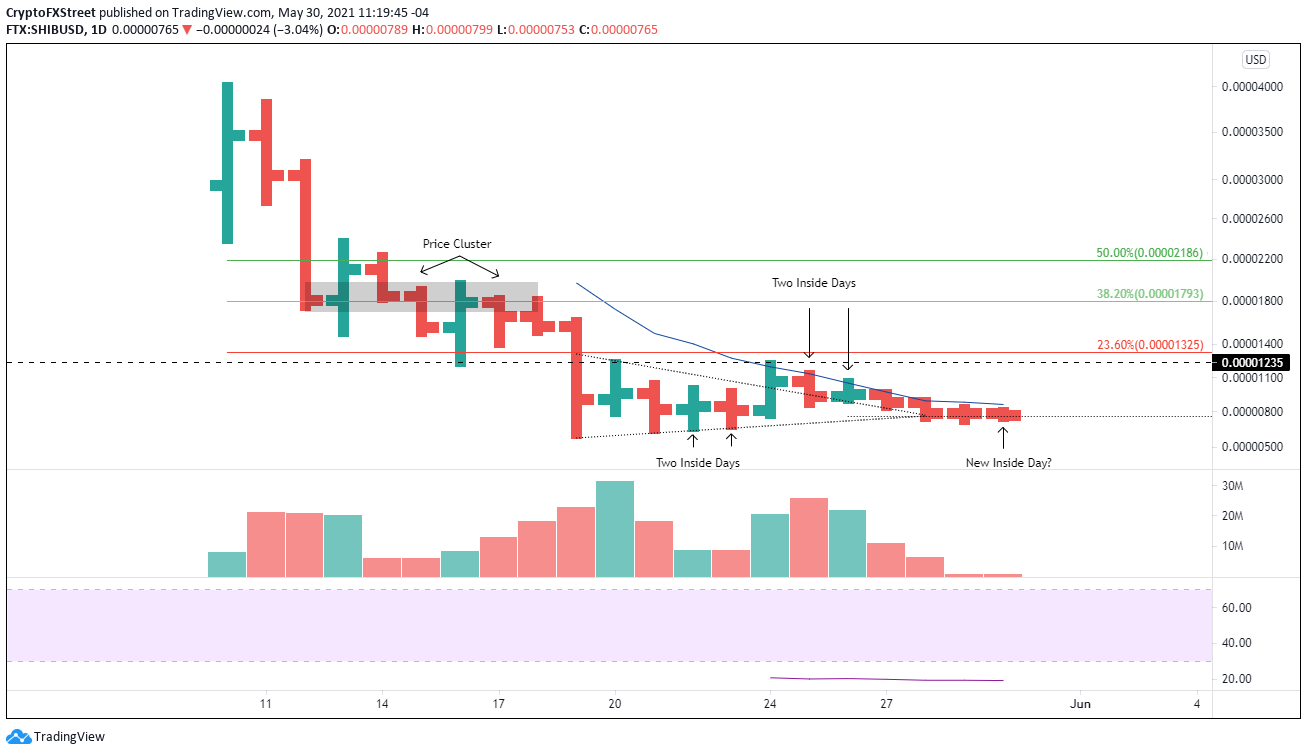
SHIB/USD daily chart
A close below the head of the head-and-shoulders pattern at $0.00000727 would void a bullish SHIB narrative. A decline below the May 19 low at $0.00000607 would confirm a negative outlook and leave Shiba Inu price vulnerable to continuing the larger downtrend originating on May 10.
For four of the past eight trading days, Shiba Inu price has closed with an inside day, reflecting an extraordinary level of indecision. Of course, some of the hesitation is a function of the volatility in the broader cryptocurrency complex. It also stems from the lack of price history to produce firm price forecasts and limited knowledge about SHIB. Hence, the cryptocurrency may require a large, loud and funny community like Dogecoin to overcome the uncertainty and drive price higher.
Note: All information on this page is subject to change. The use of this website constitutes acceptance of our user agreement. Please read our privacy policy and legal disclaimer. Opinions expressed at FXstreet.com are those of the individual authors and do not necessarily represent the opinion of FXstreet.com or its management. Risk Disclosure: Trading foreign exchange on margin carries a high level of risk, and may not be suitable for all investors. The high degree of leverage can work against you as well as for you. Before deciding to invest in foreign exchange you should carefully consider your investment objectives, level of experience, and risk appetite. The possibility exists that you could sustain a loss of some or all of your initial investment and therefore you should not invest money that you cannot afford to lose. You should be aware of all the risks associated with foreign exchange trading, and seek advice from an independent financial advisor if you have any doubts.
Recommended Content
Editors’ Picks

SEC Crypto Task Force plans to establish digital asset regulatory sandbox
The Securities & Exchange Commission's (SEC) Crypto Task Force met with El Salvador's National Commission on Digital Assets (CNAD) representatives to discuss cross-border regulation and a proposed cross-border sandbox project.

DeFi Dev Corp buys additional 65,305 SOL amid broader institutional interest: Solana price slides below $150
Solana (SOL) price faces growing overhead pressure and slides below $150 to trade at $148 at the time of writing on Thursday. The sudden pullback follows the crypto market's edging higher on improving investor sentiment, which saw SOL climb to $154 on Wednesday.

Uniswap Price Forecast: UNI whale moves 9 million tokens to Coinbase Prime
Uniswap (UNI) price hovers around $5.92 at the time of writing on Thursday, having rallied 12.8% so far this week. According to Wu Blockchain, data shows that the address potentially related to the Uniswap team, investor, or advisor transferred 9 million UNI to the Coinbase Prime Deposit on Thursday.

Tron DAO announces $70B USDT supply: Here's how TRX price could react
TRON’s USDT circulation just surpassed $70 billion, signaling rising network utility as TRX price approaches a technically significant breakout. On Wednesday, TRON DAO confirmed that the circulating supply of Tether (USDT) on its blockchain has surpassed $70 billion.

Bitcoin Weekly Forecast: BTC holds steady, Fed warns of tariffs’ impact, as Gold hits new highs
Bitcoin price consolidates above $84,000 on Friday, a short-term support that has gained significance this week. The world's largest cryptocurrency by market capitalization continued to weather storms caused by US President Donald Trump's incessant trade war with China after pausing reciprocal tariffs for 90 days on April 9 for other countries.

The Best brokers to trade EUR/USD
SPONSORED Discover the top brokers for trading EUR/USD in 2025. Our list features brokers with competitive spreads, fast execution, and powerful platforms. Whether you're a beginner or an expert, find the right partner to navigate the dynamic Forex market.