Shiba Inu looks weak as SHIB price struggles to find support amid short trading history
- Shiba Inu looks unable to hold above $0.00003535 and is looking for support.
- SHIB price has not had many technical elements that provide enough support in a longer time frame.
- Expect support from either the monthly S1 support or a technical support level holding 25% devaluation.
Shiba Inu (SHIB) is for now at the mercy of bears that are pushing SHIB prices further to the downside, breaking below the critical $0.00003535 level this week. As bulls are looking for good entry points, there are no fundamental entry points, for now, unless further down the line. Expect SHIB price to tank towards either $0.00003000, with the monthly S1 support level, or towards $0.00002640 with the historical start of the rally at the third week of October.
Although the current outlook is grim, a bullish knee-jerk reaction is just around the corner
Shiba Inu price showed some promising bullish signs last week, as the level at $0.00003535 held and bulls were able to close above it for the week. But this week, the different central bank rate decisions proved too much for SHIB investors, and price action broke to the downside, looking for support. The only issue is that there is no solid historical support available as SHIB price only exists for almost seven months.
SHIB bulls can pinch on the S1 monthly support level at $0.00003000 that acted as good support in the significant correction Shiba Inu price action had at the end of November. If that level does not hold, expect a leg lower towards $0.00002640, which acted as support on the retest after the break higher above $0.00003535 mid-October. As the floor acted as a launching platform for the higher rally, expect this level to hold as support.
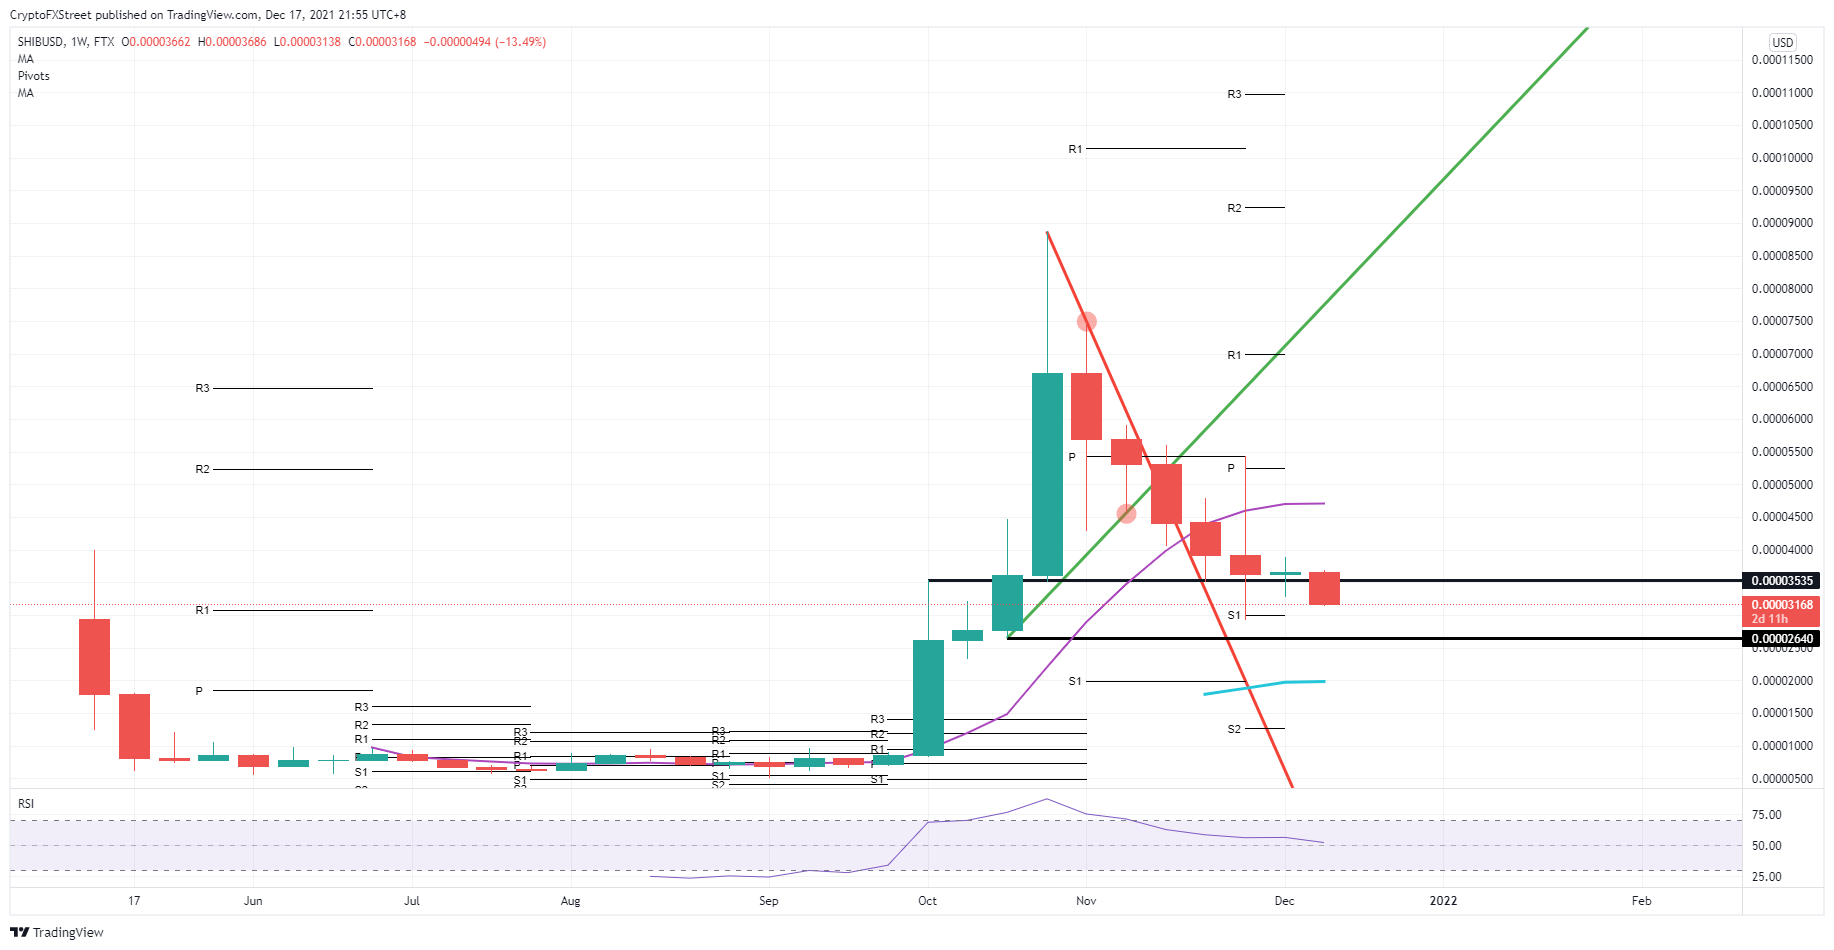
SHIB/USD weekly chart
If investors see a pick up in SHIB price action going into Christmas, a turnaround could be in the making as bulls would gladly stock some Shiba Inu coins at these discounts. Most 2022 forecasts are coming out around this time of year, and most are very bullish on cryptocurrencies, creating a favorable tailwind that should lift sentiment and be able to push price action back towards or above $0.00003535. To the upside, the 55-day Simple Moving Average (SMA) looks to be the first test for profit-taking and if a fade in the price action can be avoided, near $0.00004728.
Author

Filip Lagaart
FXStreet
Filip Lagaart is a former sales/trader with over 15 years of financial markets expertise under its belt.


