- Shiba Inu price action made a perfect bounce off a supportive pivot.
- SHIB bulls supported price action during the fade on Thursday and are set to break the high of yesterday.
- Expect a further uptick and two small hurdles before a 40% appreciation.
Shiba Inu (SHIB) price saw bulls in contained profit-taking mode as global markets pushed for a down day, on Thursday. This morning, however, bulls have come storming out of the gates and have already pared back Thursday’s losses. Expect a further uptick from here and solid gains going into the weekend, with two hurdles on the way before booking 40% gains by the end of next week.
Once global markets go all-in to risk-on, expect SHIB to spike 40%
Shiba Inu has delivered a bullish signal to investors after yesterday's gloomy downbeat day in global markets, when SHIB price action withstood deepening losses as bears tried to push bulls back against the monthly S1 support level at $0.000025. But bears failed, and bulls limited losses, which were quickly recouped this morning, with SHIB price printing green numbers during the Asian and European session thus far.
SHIB price will have bulls setting their minds on $0.000037 next, with the monthly pivot and the 55-day (Simple Moving Average) as the first trigger for booking some profit along the way. Bulls that enter today can do so at market and park their stops either below the 78.6% Fibonacci level at $0.000028 or below the monthly S1 support level below $0.000025, depending on what type of trader they are, and how big a risk/reward ratio they are comfortable carrying. . In the case of putting the stop below the monthly S1, it makes sense for them to sit on their hands and not close the long trade out at the 55-day SMA and monthly pivot, but keep at least half for the R1 resistance level at $0.000045 that falls in line with the 61.8% Fibonacci level, making it a double level of importance.
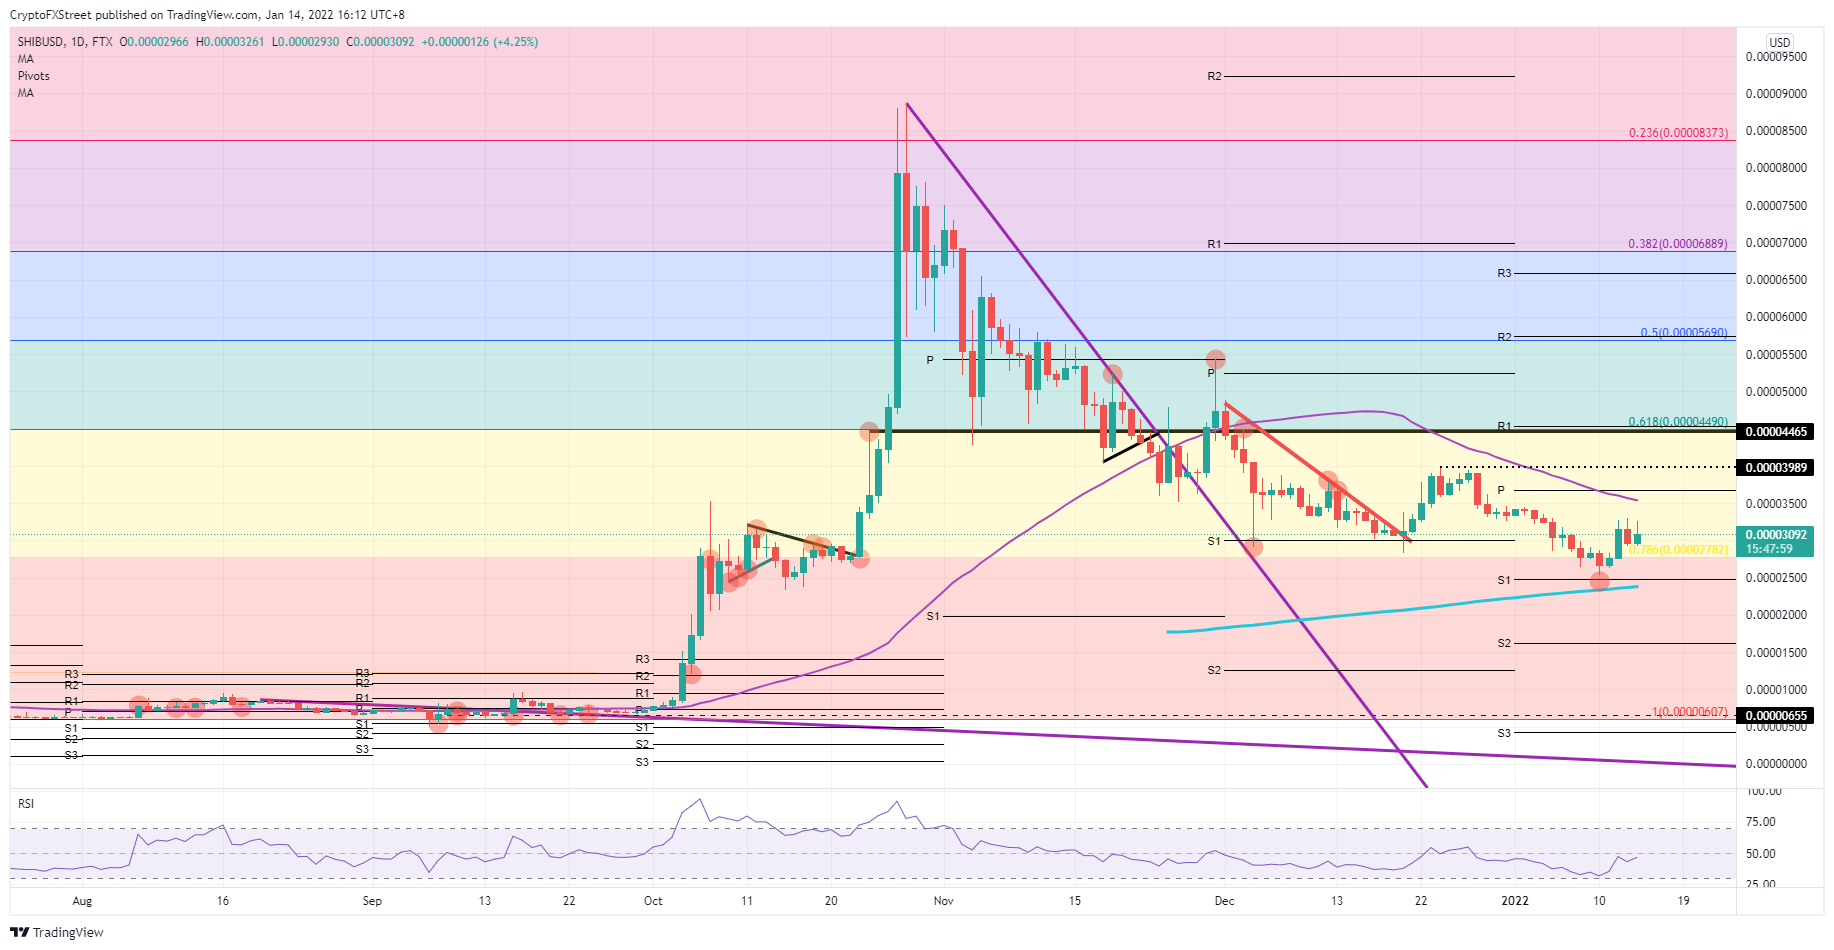
SHIB/USD daily chart
The question at hand is if current global markets can still rally as more and more central banks are tightening. If global markets start to reprice even more to the downside, expect investors to lose faith in the uptrend, and for a quick return towards $0.000025, with S1 and 200-day Simple Moving Average (SMA) as support. If that breaks, a nosedive looks set to begin towards $0.0000061 and the beginning of the Fibonacci retracement.
Information on these pages contains forward-looking statements that involve risks and uncertainties. Markets and instruments profiled on this page are for informational purposes only and should not in any way come across as a recommendation to buy or sell in these assets. You should do your own thorough research before making any investment decisions. FXStreet does not in any way guarantee that this information is free from mistakes, errors, or material misstatements. It also does not guarantee that this information is of a timely nature. Investing in Open Markets involves a great deal of risk, including the loss of all or a portion of your investment, as well as emotional distress. All risks, losses and costs associated with investing, including total loss of principal, are your responsibility. The views and opinions expressed in this article are those of the authors and do not necessarily reflect the official policy or position of FXStreet nor its advertisers. The author will not be held responsible for information that is found at the end of links posted on this page.
If not otherwise explicitly mentioned in the body of the article, at the time of writing, the author has no position in any stock mentioned in this article and no business relationship with any company mentioned. The author has not received compensation for writing this article, other than from FXStreet.
FXStreet and the author do not provide personalized recommendations. The author makes no representations as to the accuracy, completeness, or suitability of this information. FXStreet and the author will not be liable for any errors, omissions or any losses, injuries or damages arising from this information and its display or use. Errors and omissions excepted.
The author and FXStreet are not registered investment advisors and nothing in this article is intended to be investment advice.
Recommended Content
Editors’ Picks

Grayscale files S-3 form for Digital Large Cap ETF comprising Bitcoin, Ethereum, XRP, Solana, and Cardano
Grayscale, a leading digital asset manager operating the GBTC ETF, has filed the S-3 form with the United States (US) Securities and Exchange Commission (SEC) in favor of a Digital Large Cap ETF.

Top 3 Price Prediction Bitcoin, Ethereum, Ripple: BTC, ETH, and XRP brace for volatility amid Trump’s ‘Liberation Day’
Bitcoin price faces a slight rejection around its $85,000 resistance level on Wednesday after recovering 3.16% the previous day. Ripple follows BTC as it falls below its critical level, indicating weakness and a correction on the horizon.

Top crypto news: VanEck hints at BNB ETF, Circle files S-1 application for IPO
Asset manager VanEck registered a BNB Trust in Delaware on Tuesday, marking its intention to register for an ETF product with the Securities & Exchange Commission (SEC).

Solana Price Forecast for April 2025: SOL traders risk $120 reversal as FTX begins $800M repayments on May 30
Solana price consolidated below $130 on Tuesday, facing mounting headwinds in April as investors grow wary of looming FTX sell-offs.

Bitcoin: BTC remains calm before a storm
Bitcoin's price has been consolidating between $85,000 and $88,000 this week. A K33 report explains how the markets are relatively calm and shaping up for volatility as traders absorb the tariff announcements. PlanB’s S2F model shows that Bitcoin looks extremely undervalued compared to Gold and the housing market.

The Best brokers to trade EUR/USD
SPONSORED Discover the top brokers for trading EUR/USD in 2025. Our list features brokers with competitive spreads, fast execution, and powerful platforms. Whether you're a beginner or an expert, find the right partner to navigate the dynamic Forex market.