![]() Cointelegraph Team
Cointelegraph Team
Cointelegraph
Meme-cryptocurrency Shiba Inu (SHIB) has lost more than 50% of its market valuation in three weeks since its all-time highs in late October.
SHIB price dropped to as low as $0.00004251 on Nov. 19 after correcting by almost 55% from its all-time high of $0.00008854. Its price recovered a small portion of its losses on Friday, but the move looked indecisive due to weaker trade volumes, i.e., not many traders supported the rebound trend.
Some analysts noted that a sharp pullback in the Shiba Inu market was unavoidable after its price skyrocketed by more than 1,100% since Oct. 1.
For instance, an independent market analyst, under the pseudonym John Wick, called SHIB's ongoing price correction a "topping signal," thus suggesting additional selloffs in the sessions ahead.
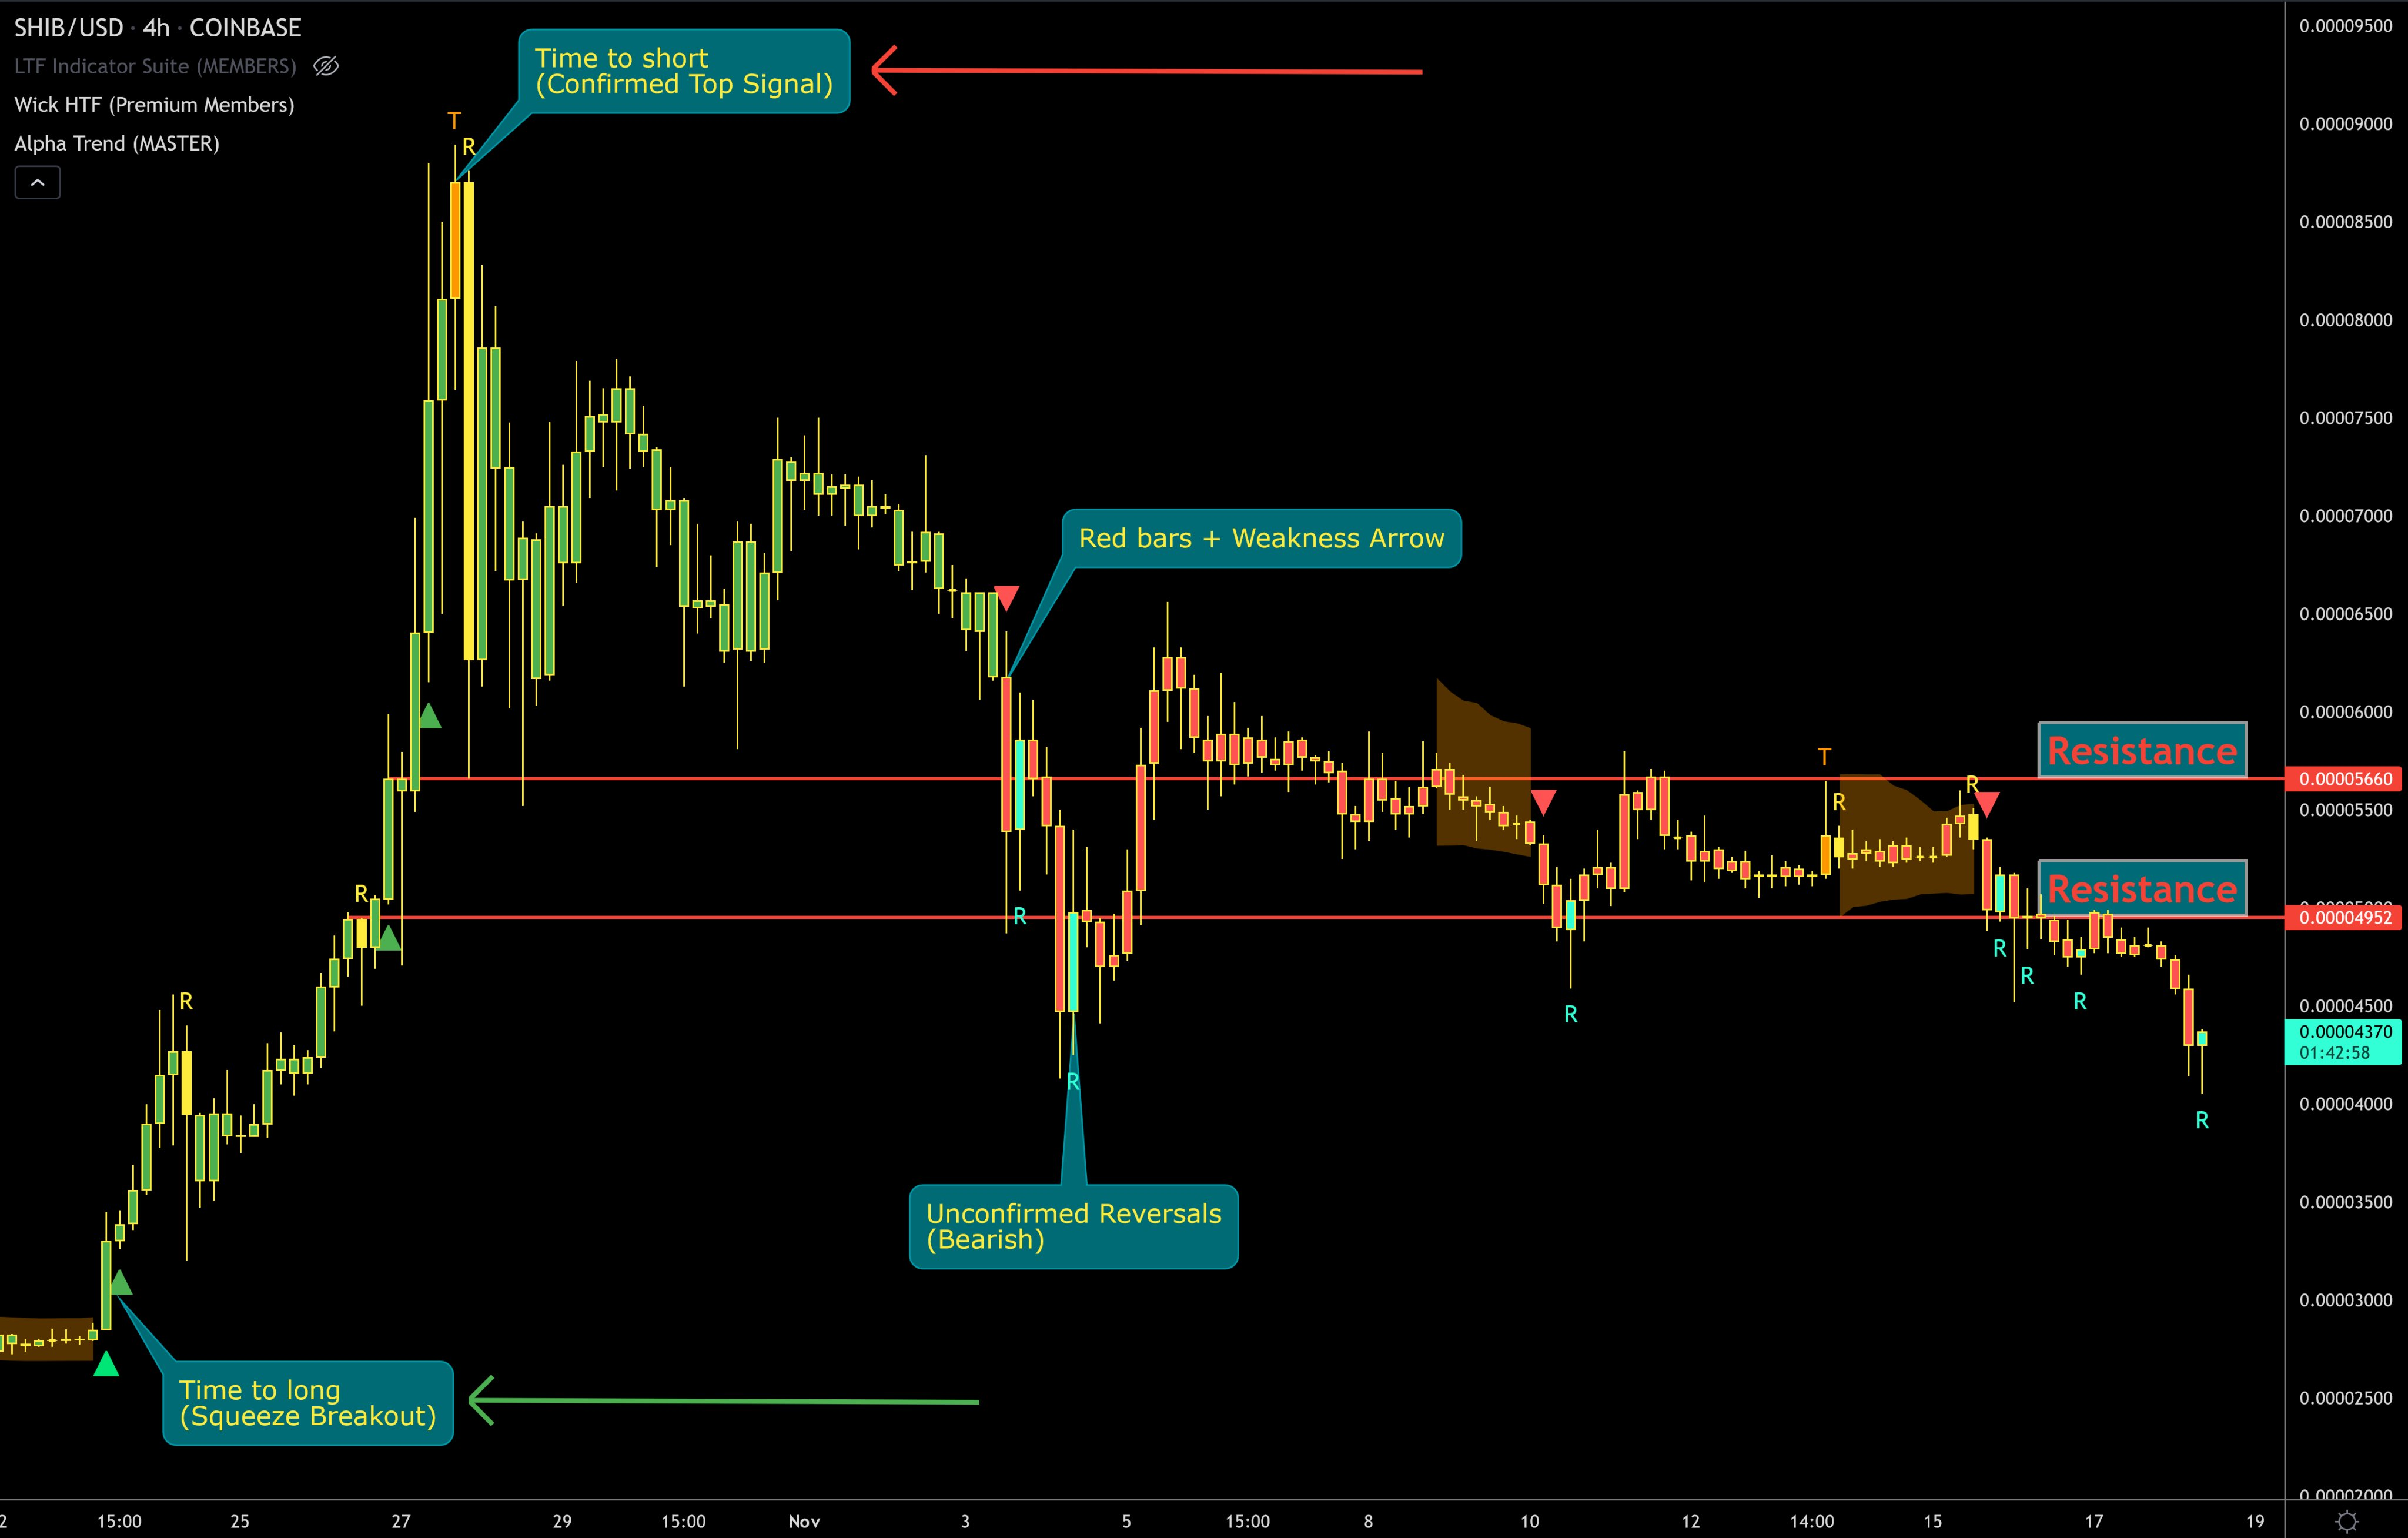
SHIB/USD four-hour price chart. Source: TradingView, John Wick
"Buying the dips"
Price swings of 50% or more are not too uncommon in the cryptocurrency market. For example, Bitcoin had plunged from around $65,000 to below $30,000 in less than thirty days earlier this year. But later, BTC rebounded to establish a new record high at $69,000.
At the core of Bitcoin's volatile rebound was a well-circulated narrative that projected it as a hedge against rising inflation all across the world. Meanwhile, for Shiba Inu, the core bullish narrative remains "community," as stated by one of the coin's most popular endorsers, David Gokhshtein.
The founder of Gokhshtein Media and CEO of PAC Protocol reminded that Shiba Inu's bullish performance this year has come on the back of strengthening community support and despite absence of major endorsements by celebrities and billionaires.
Gokhshtein tweeted Friday asking his followers who among them are "buying the dips," thus also reiterating his faith in a potential SHIB price rebound even after a 50%-plus price correction.
Bul technical outlook
Shiba Inu's ongoing price correction had it trend lower inside what appeared like a Bull Flag range, raising possibilities that the coin would continue its move higher in the future.
In detail, Bull Flags occurs as a brief pause in the trend after a strong price move higher.
The pattern looks like a downward sloping channel/rectangle represented by two parallel falling trendlines. Typically, Bull Flags result in price breaking out of the upper trendline to levels at length equal to the height of the previous uptrend (called Flagpole).
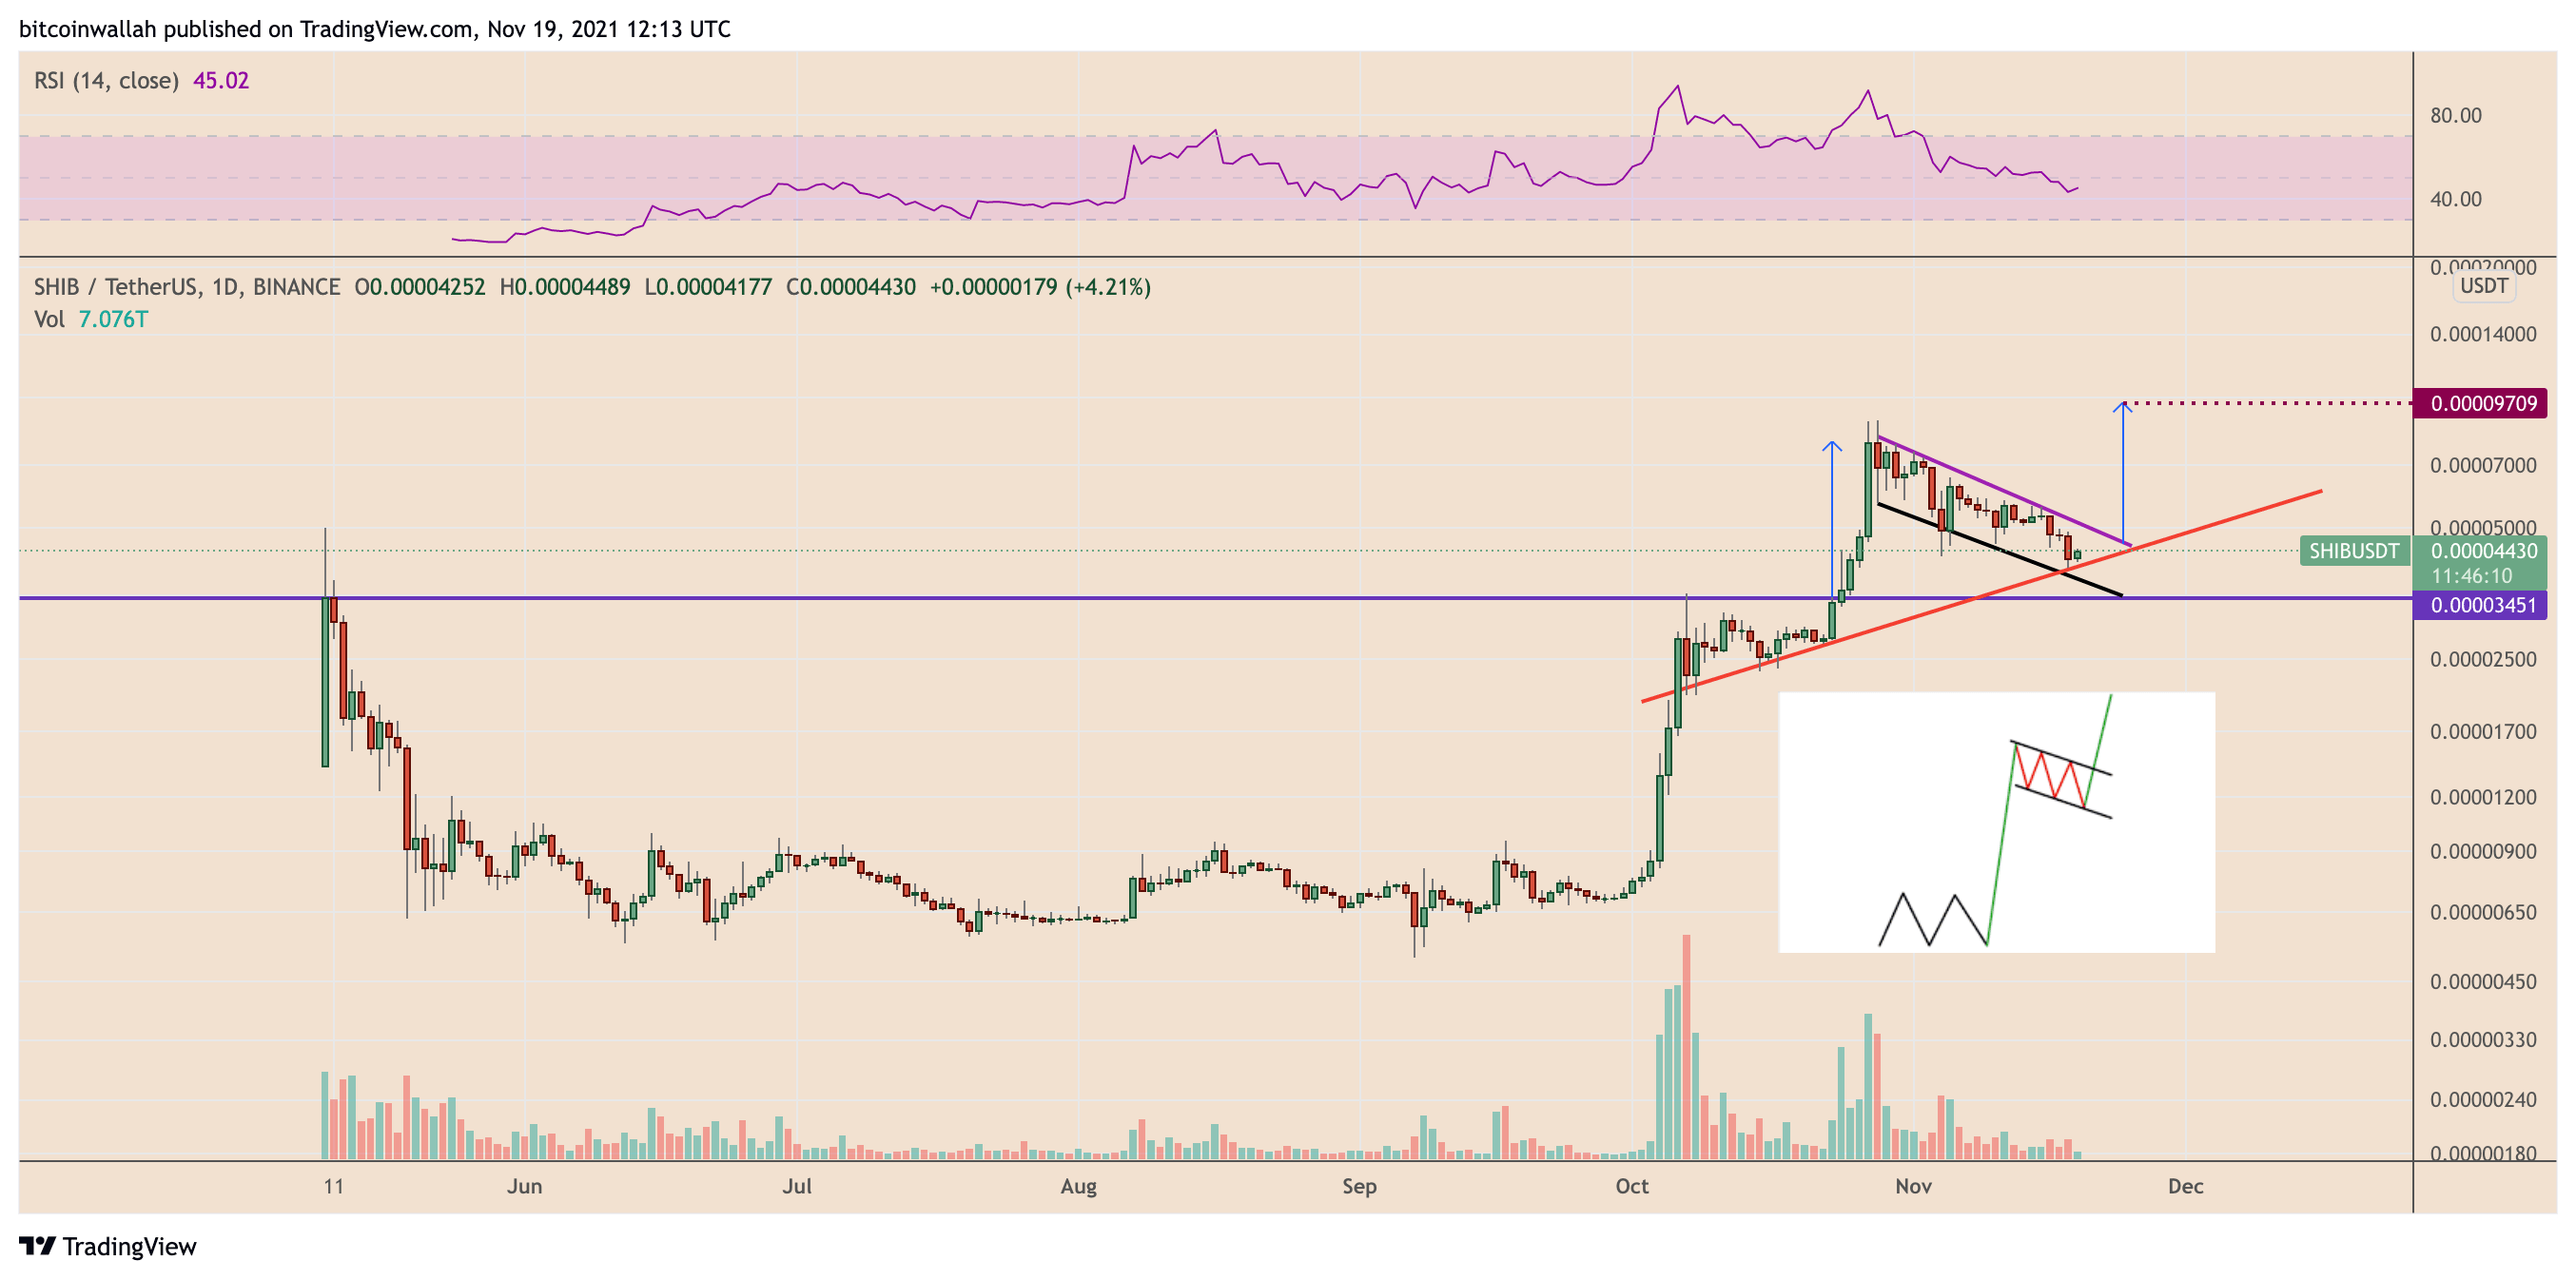
SHIB/USDT daily price chart featuring Bull Flag. Source: TradingView
With that said, SHIB's next attempt to break above its Flag's upper trendline, if accompanied by a rise in trading volume, could result in a price leg higher toward $0.00010000.
Information on these pages contains forward-looking statements that involve risks and uncertainties. Markets and instruments profiled on this page are for informational purposes only and should not in any way come across as a recommendation to buy or sell in these assets. You should do your own thorough research before making any investment decisions. FXStreet does not in any way guarantee that this information is free from mistakes, errors, or material misstatements. It also does not guarantee that this information is of a timely nature. Investing in Open Markets involves a great deal of risk, including the loss of all or a portion of your investment, as well as emotional distress. All risks, losses and costs associated with investing, including total loss of principal, are your responsibility. The views and opinions expressed in this article are those of the authors and do not necessarily reflect the official policy or position of FXStreet nor its advertisers.
Recommended Content
Editors’ Picks

Shiba Inu eyes positive returns in April as SHIB price inches towards $0.000015
Shiba Inu's on-chain metrics reveal robust adoption, as addresses with balances surge to 1.4 million. Shiba Inu's returns stand at a solid 14.4% so far in April, poised to snap a three-month bearish trend from earlier this year.

AI tokens TAO, FET, AI16Z surge despite NVIDIA excluding crypto-related projects from its Inception program
AI tokens, including Bittensor and Artificial Superintelligence Alliance, climbed this week, with ai16z still extending gains at the time of writing on Friday. The uptick in prices of AI tokens reflects a broader bullish sentiment across the cryptocurrency market.

Bitcoin Weekly Forecast: BTC consolidates after posting over 10% weekly surge
Bitcoin price is consolidating around $94,000 at the time of writing on Friday, holding onto the recent 10% increase seen earlier this week. This week’s rally was supported by strong institutional demand, as US spot ETFs recorded a total inflow of $2.68 billion until Thursday.

XRP price could renew 25% breakout bid on surging institutional and retail adoption
Ripple price consolidates, trading at $2.18 at the time of writing on Friday, following mid-week gains to $2.30. The rejection from this weekly high led to the price of XRP dropping to the previous day’s low at $2.11, followed by a minor reversal.
Bitcoin Weekly Forecast: BTC consolidates after posting over 10% weekly surge
Bitcoin (BTC) price is consolidating around $94,000 at the time of writing on Friday, holding onto the recent 10% increase seen earlier this week.

The Best brokers to trade EUR/USD
SPONSORED Discover the top brokers for trading EUR/USD in 2025. Our list features brokers with competitive spreads, fast execution, and powerful platforms. Whether you're a beginner or an expert, find the right partner to navigate the dynamic Forex market.