- Shiba Inu has hit its topside at $0.0000095 and fallen 16% in value in just two days.
- Price is consolidating today and looks set to run lower in search of support.
- There is a silver lining on the horizon with a few supports close to one another.
Shiba Inu has had its run higher but hit a cap at the beginning of the week. A full correction has taken place, wiping out almost the entire profit of two weeks' gains. The velocity at which buyers have been squeezed out of their longs shows that short-sellers were waiting for a moment to strike. The shift in sentiment has taken over control of SHIB price and is pushing price action further down.
Shiba Inu has been tackled in speed by the correction
But there is a silver lining nearby as yesterday Shiba Inu barely touched critical support at $0.0000076. The graph shows price action has hovered above and below that marker with a few retests from time to time on both sides, proving its importance. Price action could still hold above yesterday and today to show that buyers are still keen to step in at decent levels.
Even if that level were to break, SHIB still has a double layer of support below around $0.0000073. Around that level, SHIB has the red descending trend line coming and the 55-day Simple Moving Average (SMA), which act both as support and a good entry point to bounce off.
The 55-day SMA had shown its importance back on August 8 when prices bounced off that SMA and got a 22% move in just one day. Also, it was the catalyst to have SHIB break the red descending trend line to the upside.
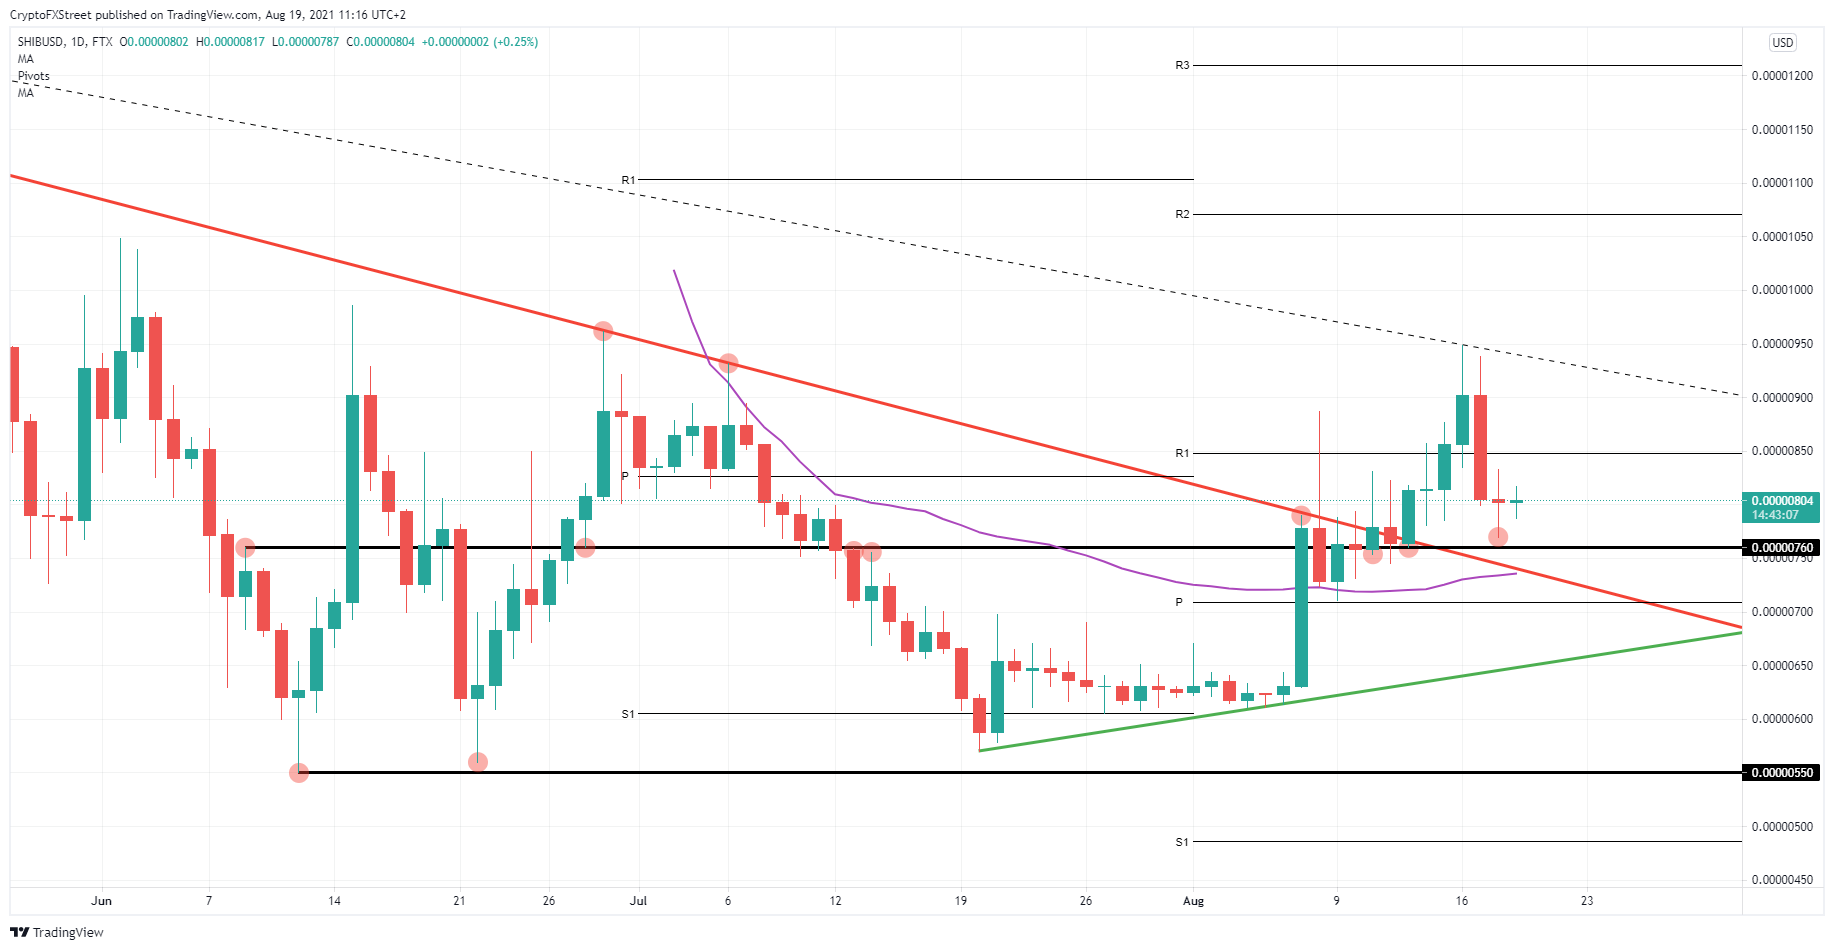
SHIB/USD daily chart
If that does not make the trade, just above at $0.0000070 the monthly pivot also proved its importance on August 09 as SHIB price bounced off there in a premonition of the run higher that concluded a profit of 33%.
Buyers will be a bit puzzled about the move but expect people to wait out this move and have the dust settled. If there are still enough buyers in SHIB to control price action, expect a run higher again but limited to that dotted descending trend line. $0.0000090 should be a possible price target for the next run higher.
Information on these pages contains forward-looking statements that involve risks and uncertainties. Markets and instruments profiled on this page are for informational purposes only and should not in any way come across as a recommendation to buy or sell in these assets. You should do your own thorough research before making any investment decisions. FXStreet does not in any way guarantee that this information is free from mistakes, errors, or material misstatements. It also does not guarantee that this information is of a timely nature. Investing in Open Markets involves a great deal of risk, including the loss of all or a portion of your investment, as well as emotional distress. All risks, losses and costs associated with investing, including total loss of principal, are your responsibility. The views and opinions expressed in this article are those of the authors and do not necessarily reflect the official policy or position of FXStreet nor its advertisers. The author will not be held responsible for information that is found at the end of links posted on this page.
If not otherwise explicitly mentioned in the body of the article, at the time of writing, the author has no position in any stock mentioned in this article and no business relationship with any company mentioned. The author has not received compensation for writing this article, other than from FXStreet.
FXStreet and the author do not provide personalized recommendations. The author makes no representations as to the accuracy, completeness, or suitability of this information. FXStreet and the author will not be liable for any errors, omissions or any losses, injuries or damages arising from this information and its display or use. Errors and omissions excepted.
The author and FXStreet are not registered investment advisors and nothing in this article is intended to be investment advice.
Recommended Content
Editors’ Picks

TRUMP plummets 32% from April highs as President Trump denies profiting from the meme coin
The Official Trump meme coin struggles to hold above critical support at $10.00 while exchanging hands at $11.12 at the time of writing on Monday. Despite a slight increase on the day, the meme coin appears weighed down by sell-side pressure, possibly due to profit-taking.

Bitcoin hovers around $95,000 as Trump hints at mixed signals on the economy, trade deals
Bitcoin price is hovering around $95,000 at the time of writing on Monday after facing a pullback of nearly 3% over the weekend. US President Donald Trump acknowledged a possible recession but aims to announce at least one trade deal this week, the Wall Street Journal reports.
Ethena, Movement look set for heightened volatility as $58 million token unlock looms
Ethena (ENA) and Movement (MOVE) are among the altcoins facing large token unlocks this week, pointing at potential incoming volatility. Large token cliff unlocks are often characterized by increased volatility and even price drops.

Ripple Price Prediction: Examining why XRP price is struggling to sustain the uptrend
Ripple (XRP) price is yet to make headway in its broader recovery potential, targeting $3.00 in the medium term. The cross-border money remittance token hovers at $2.17 at the time of writing on Monday, up slightly on the day.

Bitcoin Weekly Forecast: BTC looks set to head back to $100K after logging fourth straight week of gains
Bitcoin (BTC) price is hovering around $97,000 at the time of writing on Friday, following a decisive breakout above its key resistance level the previous day, and looks set to post a fourth consecutive week of gains.

The Best brokers to trade EUR/USD
SPONSORED Discover the top brokers for trading EUR/USD in 2025. Our list features brokers with competitive spreads, fast execution, and powerful platforms. Whether you're a beginner or an expert, find the right partner to navigate the dynamic Forex market.