• Shiba Inu price action is mostly unchanged on its Point and Figure chart.  
  • Surprisingly, SHIBA triggered a hypothetical long entry previously identified last week.
  • Downside risks remain considerable and could be in the extremes.

Shiba Inu price action fulfilled an Ideal Bearish Ichimoku Breakout on its daily Ichimoku chart on Friday's close. This is the first time this bearish entry condition has appeared since November 22, 2021. Thus far, bears have not followed through with a continuation move in selling pressure. News regarding a temporary ceasefire in Ukraine may contribute to a return of positive risk-on sentiment very soon.

Shiba Inu price is at risk of creating new 2022 lows, pushing as low as $0.00001200

Shiba Inu price action is now overwhelmingly bearish. On Monday, there was hope that SHIBA was positioned for an Ideal Bullish Ichimoku Breakout. The threshold of completing that most bullish of Ichimoku entries dropped significantly from prior weeks, but bulls were unable or unwilling to capitalize on the new positioning.

Instead, bulls saw Shiba Inu price get rejected at the Kijun-Sen and top of the Ichimoku Cloud in the $0.00002800 to $0.00002850 value area. Friday's close confirmed an Ideal Bearish Ichimoku Breakout, putting SHIBA into the most bearish condition it's been in since November 2021. SHIBA could very easily and very quickly fall to the 161.8% Fibonacci expansion at $0.00001200.

However, despite the bearish development on the Ichimoku chart, SHIBA's Point and Figure chart continues to show no change since triggering a prior long entry idea. That entry is still valid if traders missed it; it remains an appropriate entry opportunity before any positive risk-on sentiment returns to this market.

The hypothetical long entry for Shiba Inu price was a buy stop order on the three-box reversal of Xs that formed off the previous O-column. That entry was triggered at $0.00002800. The entry is still valid. The stop loss is at $0.00001200, and the profit target is at $0.0004540. The trade represents a 4.33:1 reward for the risk setup. A trailing stop of two to three boxes would help protect any profit made post entry.

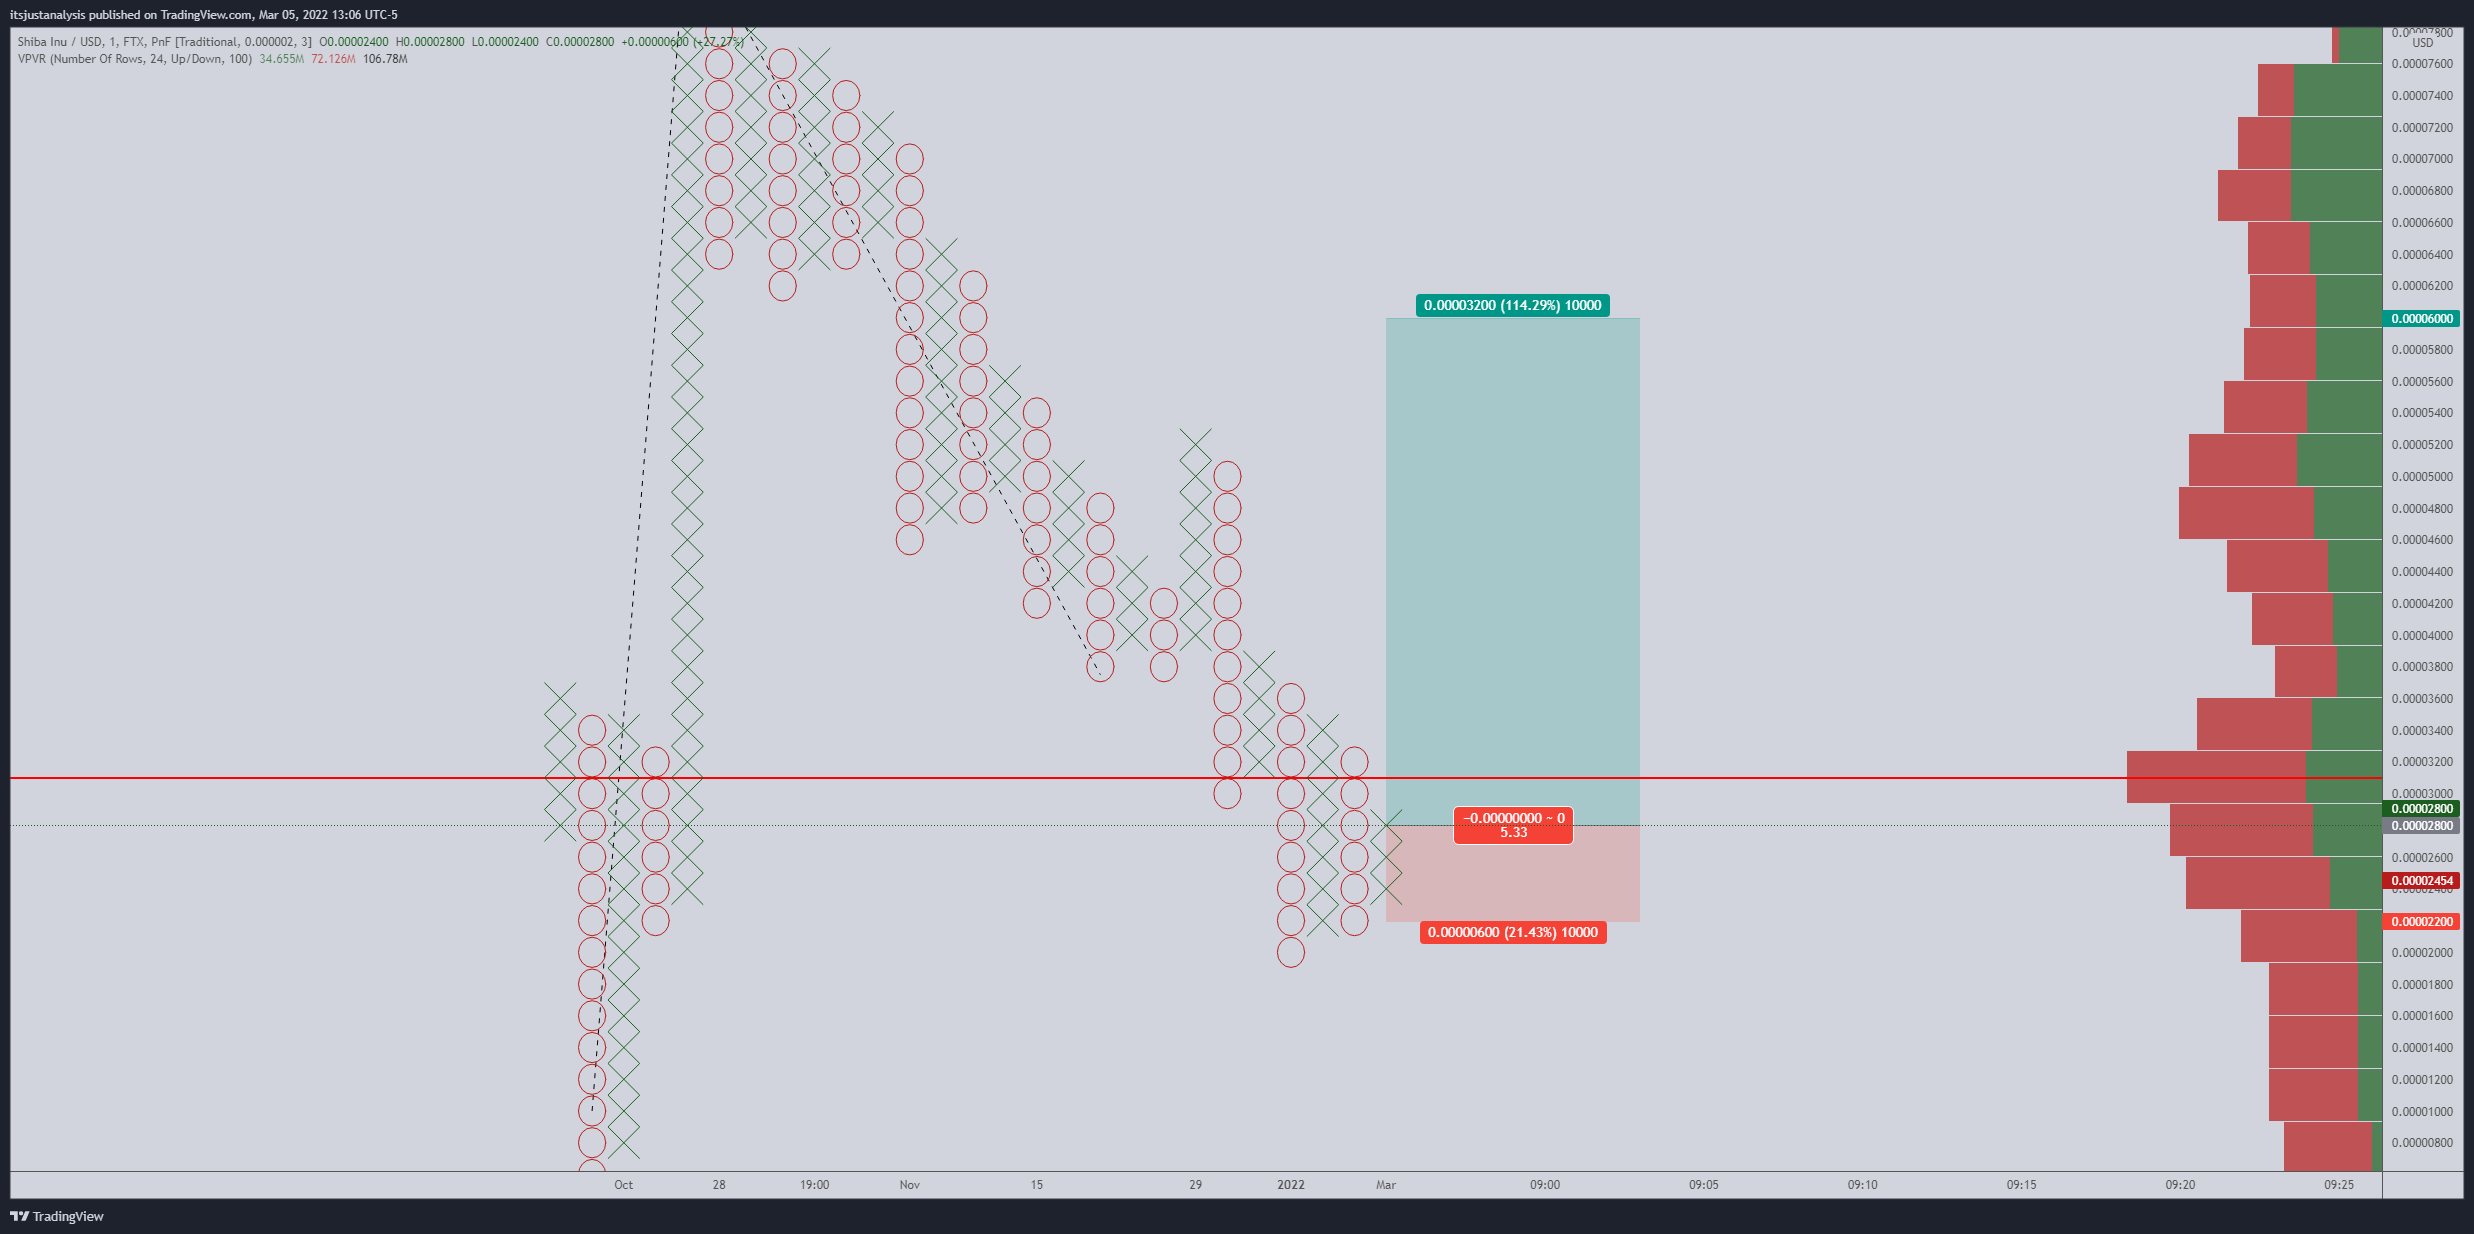
SHIBA/USDT $0.000002/3-box Reversal Point and Figure Chart

The long trade idea is invalidated if Shiba Inu price falls to $0.00001400 or lower before the entry is triggered. However, if SHIBA continues to move lower, the entry and stop-loss move in tandem – but the profit target remains the same.


Note: All information on this page is subject to change. The use of this website constitutes acceptance of our user agreement. Please read our privacy policy and legal disclaimer. Opinions expressed at FXstreet.com are those of the individual authors and do not necessarily represent the opinion of FXstreet.com or its management. Risk Disclosure: Trading foreign exchange on margin carries a high level of risk, and may not be suitable for all investors. The high degree of leverage can work against you as well as for you. Before deciding to invest in foreign exchange you should carefully consider your investment objectives, level of experience, and risk appetite. The possibility exists that you could sustain a loss of some or all of your initial investment and therefore you should not invest money that you cannot afford to lose. You should be aware of all the risks associated with foreign exchange trading, and seek advice from an independent financial advisor if you have any doubts.

Join Telegram

Recommended content


Recommended Content

Editors’ Picks

Ripple on-chain metrics show bullish signs amidst legal struggle with SEC, XRP eyes recovery

Ripple on-chain metrics show bullish signs amidst legal struggle with SEC, XRP eyes recovery

Ripple made a comeback above $0.48 on Tuesday and hovers above that level in Wednesday’s European session. Ripple on-chain metrics such as transaction volume and Network Realized Profit/Loss have turned bullish, supporting a recovery in the altcoin. 

More Ripple News

Bitcoin price falls amidst German government transfers, miners activity

Bitcoin price falls amidst German government transfers, miners activity

Bitcoin (BTC) extends correction on Wednesday and hovers around $61,000 after finding resistance near the $64,000 level on Monday. Recent on-chain data indicates heightened selling activity from Bitcoin miners early in the week. 

More Bitcoin News

Crypto Today: Bitcoin erases gains from end of June, Ethereum declines while Ripple holds

Crypto Today: Bitcoin erases gains from end of June, Ethereum declines while Ripple holds

Bitcoin wipes out gains from the last week of June and falls below $60,000 on Wednesday. Ethereum and top altcoins ranked by market capitalization erased gains as the inflation outlook worsened. Ripple holds on to recent gains and hovers above $0.48 on Wednesday. 

More Cryptocurrencies News

Three reasons why altcoins could shake off losses this week

Three reasons why altcoins could shake off losses this week

On-chain data from Santiment shows that altcoins are currently in the opportunity zone, or generating buy signals. The top three altcoins in the buy zone are Basic Attention Token (BAT), Chromia (CHR), and Highstreet (HIGH), per Santiment. 

More Altcoins News

Bitcoin: BTC price correction could end in July, according to seasonal data

Bitcoin: BTC price correction could end in July, according to seasonal data

Bitcoin (BTC) price appears poised for a decline this week, influenced by slight outflows in US spot ETFs, selling activity among BTC miners, and a combined transfer of 4,690.28 BTC to centralized exchanges by the US and German governments.

Read full analysis

BTC

ETH

XRP