- Shiba Inu price is trading sideways between $0.00002925 and $0.00003785.
- SHIB RSI is almost flat, showing a balanced equilibrium between buyers and sellers.
- Expect volatility to pick up once a catalyst lights a bullish breakout.
Shiba INU (SHIB) price is trading stuck between a 16% variation bandwidth as price looks for direction with neither buyers nor sellers putting forward any big moves. As equity markets shift further towards gains, expect this to spill over into cryptocurrencies and act as a catalyst for a bullish breakout, taking price above a top line that is capping price action for the moment. Following such a breakout, expect bulls to target a return to the 61.8% Fibonacci level at $0.00004490.
Shiba Inu awaits equities tailwind, sparking 35% rally
Shiba Inu price has been trading sideways since last week as investors find themselves puzzled as to the path forward. Much event risk lies on the horizon with a lot of rate decisions from the most prominent central banks this week and some pending uncertainties over Covid variants. On Monday, European equities already started the week in the green, and in the early trading hours, the US indices are also quoting in the green. This sentiment could be the catalyst cryptocurrency investors are awaiting to spark a late Christmas rally.
SHIB price could see bulls attempting to surmount the red descending top line from December 1st, which price recently respected, leading to several rejections to the downside. A breakthrough would be the cue for sidelined investors to join the rally.. If this is the case – and as buying volume sees a significant uptick – expect the subsequent rally to hit the 61.8% Fibonacci level at $0.00004490 quickly.
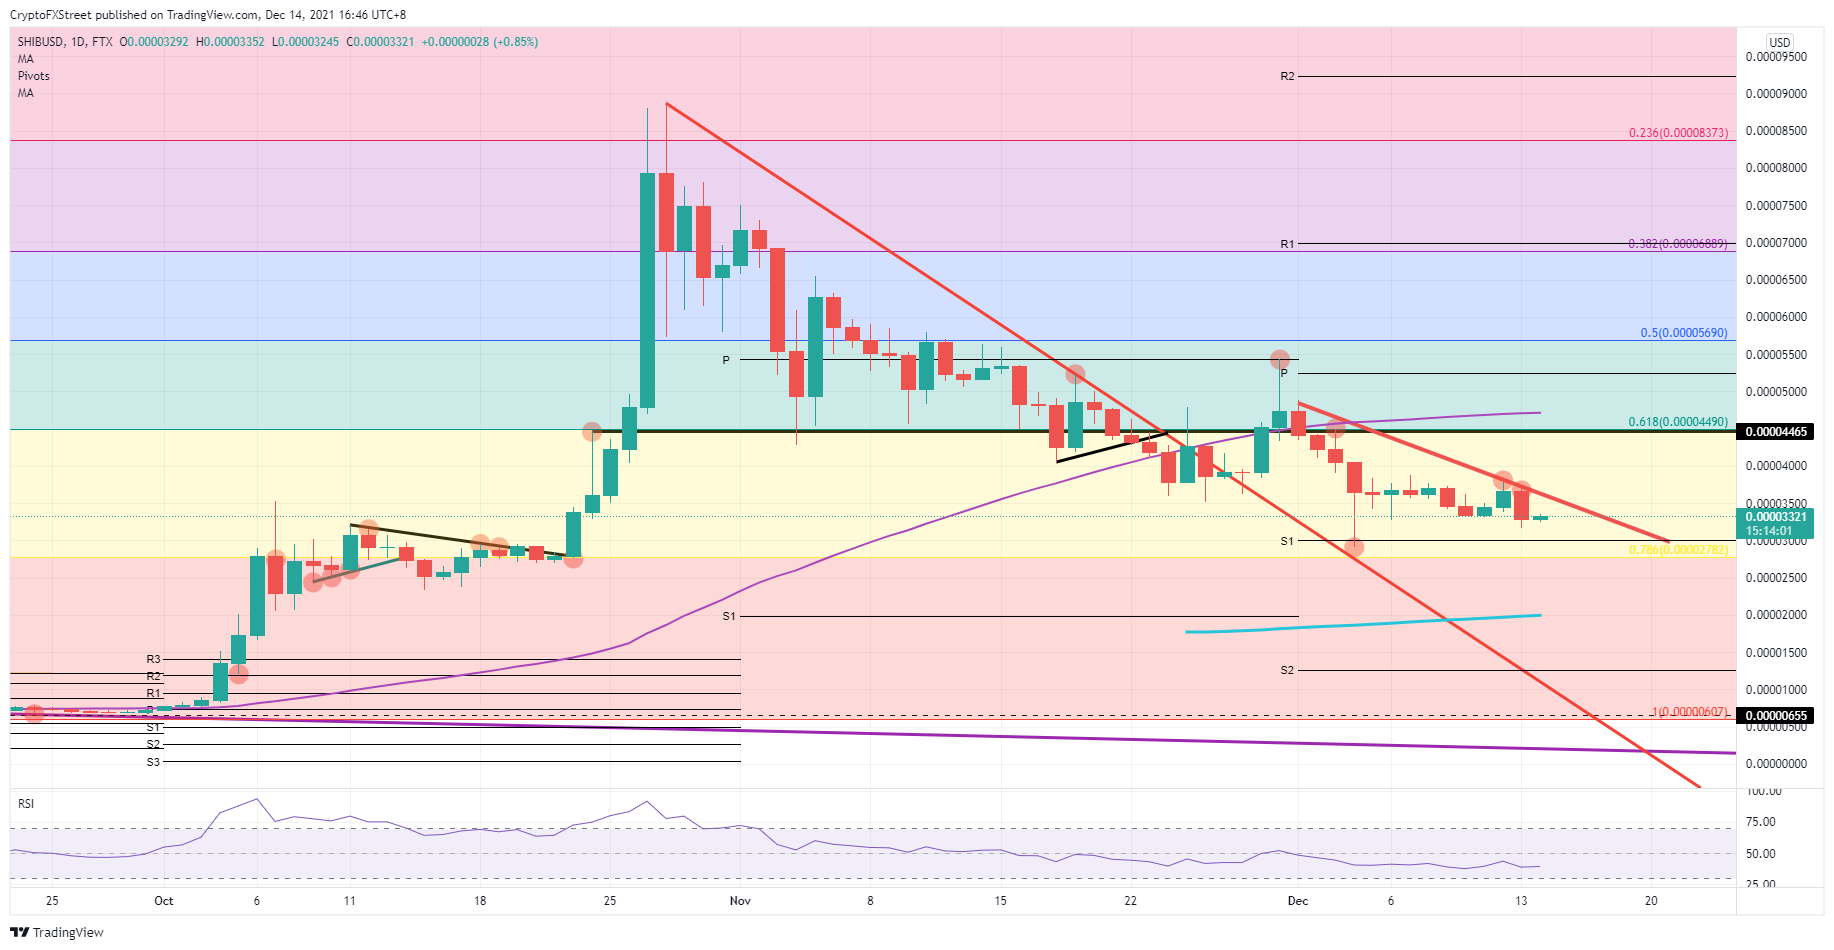
SHIB/USD daily chart
Once around that level, it will become increasingly more difficult for investors to drive SHIB price higher as liquidity starts to die down year-end. If most central banks keep their loose monetary policy going, expect a boost of confidence that would spark another leg higher towards the 50% Fibonacci level at $0.00005690. If central banks come out more hawkish, on the other hand, expect a quick deflation of the price as investors cash in on their positions, triggering a sell-off towards the monthly S2 support level at $0.00001260, holding a 60% potential loss.
Information on these pages contains forward-looking statements that involve risks and uncertainties. Markets and instruments profiled on this page are for informational purposes only and should not in any way come across as a recommendation to buy or sell in these assets. You should do your own thorough research before making any investment decisions. FXStreet does not in any way guarantee that this information is free from mistakes, errors, or material misstatements. It also does not guarantee that this information is of a timely nature. Investing in Open Markets involves a great deal of risk, including the loss of all or a portion of your investment, as well as emotional distress. All risks, losses and costs associated with investing, including total loss of principal, are your responsibility. The views and opinions expressed in this article are those of the authors and do not necessarily reflect the official policy or position of FXStreet nor its advertisers. The author will not be held responsible for information that is found at the end of links posted on this page.
If not otherwise explicitly mentioned in the body of the article, at the time of writing, the author has no position in any stock mentioned in this article and no business relationship with any company mentioned. The author has not received compensation for writing this article, other than from FXStreet.
FXStreet and the author do not provide personalized recommendations. The author makes no representations as to the accuracy, completeness, or suitability of this information. FXStreet and the author will not be liable for any errors, omissions or any losses, injuries or damages arising from this information and its display or use. Errors and omissions excepted.
The author and FXStreet are not registered investment advisors and nothing in this article is intended to be investment advice.
Recommended Content
Editors’ Picks

Cardano stabilizes near $0.62 after Trump’s 90-day tariff pause-led surge
Cardano stabilizes around $0.62 on Thursday after a sharp recovery the previous day, triggered by US Donald Trump’s decision to pause tariffs for 90 days except for China and other countries that had retaliated against the reciprocal tariffs announced on April 2.

Solana signals bullish breakout as Huma Finance 2.0 launches on the network
Solana retests falling wedge pattern resistance as a 30% breakout looms. Huma Finance 2.0 joins the Solana DeFi ecosystem, allowing access to stable, real yield. A neutral RSI and macroeconomic uncertainty due to US President Donald Trump’s tariff policy could limit SOL’s rebound.

Bitcoin stabilizes around $82,000, Dead-Cat bounce or trendline breakout
Bitcoin (BTC) price stabilizes at around $82,000 on Thursday after recovering 8.25% the previous day. US President Donald Trump's announcement of a 90-day tariff pause on Wednesday triggered a sharp recovery in the crypto market.

Top 3 gainers Flare, Ondo and Bittensor: Will altcoins outperform Bitcoin after Trump's tariff pause?
Altcoins led by Flare, Ondo and Bittensor surge on Thursday as markets welcome President Trump's tariff pause. Bitcoin rally falters as traders quickly book profits amid Trump's constantly changing tariff policy.

Bitcoin Weekly Forecast: Tariff ‘Liberation Day’ sparks liquidation in crypto market
Bitcoin (BTC) price remains under selling pressure and trades near $84,000 when writing on Friday after a rejection from a key resistance level earlier this week.

The Best brokers to trade EUR/USD
SPONSORED Discover the top brokers for trading EUR/USD in 2025. Our list features brokers with competitive spreads, fast execution, and powerful platforms. Whether you're a beginner or an expert, find the right partner to navigate the dynamic Forex market.