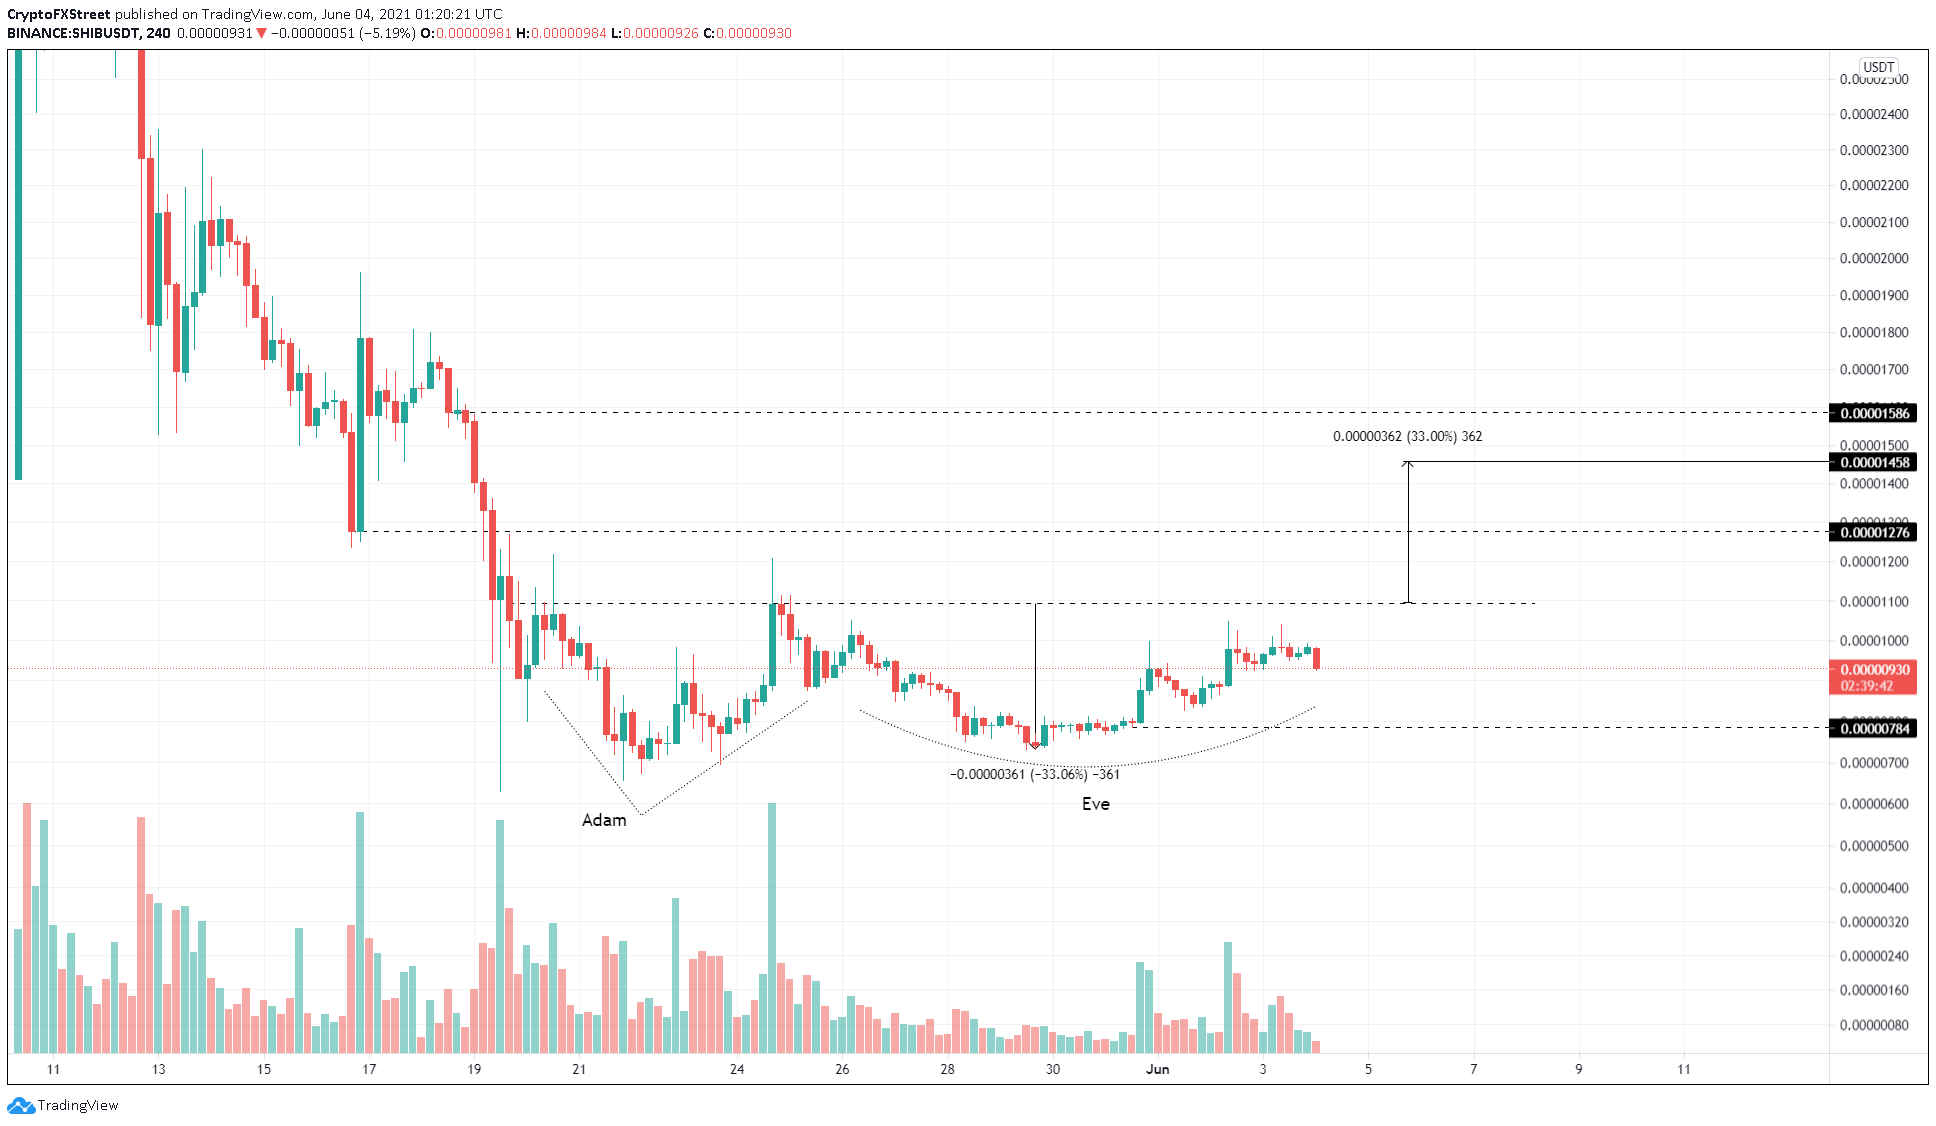
• SHIB price is setting up a potential Adam and Eve pattern, suggesting a reversal.
  • A decisive close above $0.0000109 will confirm a breakout and project a 30% upswing to $0.0000146.
  • A breakdown of 0.00000784 will invalidate the bullish thesis and trigger a downtrend.

SHIB price shows the formation of a bottom reversal technical pattern that projects a huge potential bullish breakout. However, Shiba Inu needs to produce a decisive close above a critical resistance level to kick-start this upswing.

SHIB price needs to maintain its bullishness

SHIB price action since May 20 has formed two distinct valleys known as Adam and Eve. The first swing low is narrow and v-shaped, known as Adam, while the one that follows has a rounded bottom and is referred to as Eve.

This technical formation is a bottom reversal pattern that projects a 30% upswing to $0.0000146. The target is determined by measuring the distance between the valley’s swing low to the peak and adding it to the horizontal resistance level connecting the swing highs.

Investors need to note that this is a potential pattern, and confirmation of the breakout will arrive when Shiba Inu price produces a decisive 4-hour candlestick close above $0.0000109.

If the bullish momentum persists after hitting the intended target, SHIB price could rise another 9% to tag the immediate resistance level at $0.0000159.

SHIB/USDT 4-hour chart

SHIB/USDT 4-hour chart

On the other hand, if Shiba Inu price continues to bleed, the bullish outlook will be in jeopardy. If the sellers manage to produce a convincing close below $0.00000784, it will invalidate the bullish outlook.

Confirmation of a downtrend will arrive after SHIB price closes below the swing low at $0.00000731, formed on May 29.


Information on these pages contains forward-looking statements that involve risks and uncertainties. Markets and instruments profiled on this page are for informational purposes only and should not in any way come across as a recommendation to buy or sell in these assets. You should do your own thorough research before making any investment decisions. FXStreet does not in any way guarantee that this information is free from mistakes, errors, or material misstatements. It also does not guarantee that this information is of a timely nature. Investing in Open Markets involves a great deal of risk, including the loss of all or a portion of your investment, as well as emotional distress. All risks, losses and costs associated with investing, including total loss of principal, are your responsibility. The views and opinions expressed in this article are those of the authors and do not necessarily reflect the official policy or position of FXStreet nor its advertisers. The author will not be held responsible for information that is found at the end of links posted on this page.

If not otherwise explicitly mentioned in the body of the article, at the time of writing, the author has no position in any stock mentioned in this article and no business relationship with any company mentioned. The author has not received compensation for writing this article, other than from FXStreet.

FXStreet and the author do not provide personalized recommendations. The author makes no representations as to the accuracy, completeness, or suitability of this information. FXStreet and the author will not be liable for any errors, omissions or any losses, injuries or damages arising from this information and its display or use. Errors and omissions excepted.

The author and FXStreet are not registered investment advisors and nothing in this article is intended to be investment advice.

Join Telegram

Recommended content


Recommended Content

Editors’ Picks

Ripple on-chain metrics show bullish signs amidst legal struggle with SEC, XRP eyes recovery

Ripple on-chain metrics show bullish signs amidst legal struggle with SEC, XRP eyes recovery

Ripple made a comeback above $0.48 on Tuesday and hovers above that level in Wednesday’s European session. Ripple on-chain metrics such as transaction volume and Network Realized Profit/Loss have turned bullish, supporting a recovery in the altcoin. 

More Ripple News

Bitcoin price falls amidst German government transfers, miners activity

Bitcoin price falls amidst German government transfers, miners activity

Bitcoin (BTC) extends correction on Wednesday and hovers around $61,000 after finding resistance near the $64,000 level on Monday. Recent on-chain data indicates heightened selling activity from Bitcoin miners early in the week. 

More Bitcoin News

Crypto Today: Bitcoin erases gains from end of June, Ethereum declines while Ripple holds

Crypto Today: Bitcoin erases gains from end of June, Ethereum declines while Ripple holds

Bitcoin wipes out gains from the last week of June and falls below $60,000 on Wednesday. Ethereum and top altcoins ranked by market capitalization erased gains as the inflation outlook worsened. Ripple holds on to recent gains and hovers above $0.48 on Wednesday. 

More Cryptocurrencies News

Three reasons why altcoins could shake off losses this week

Three reasons why altcoins could shake off losses this week

On-chain data from Santiment shows that altcoins are currently in the opportunity zone, or generating buy signals. The top three altcoins in the buy zone are Basic Attention Token (BAT), Chromia (CHR), and Highstreet (HIGH), per Santiment. 

More Altcoins News

Bitcoin: BTC price correction could end in July, according to seasonal data

Bitcoin: BTC price correction could end in July, according to seasonal data

Bitcoin (BTC) price appears poised for a decline this week, influenced by slight outflows in US spot ETFs, selling activity among BTC miners, and a combined transfer of 4,690.28 BTC to centralized exchanges by the US and German governments.

Read full analysis

BTC

ETH

XRP