![]() Cointelegraph Team
Cointelegraph Team
Cointelegraph
Lido DAO (LDO) has declined by more than 40% in the last 30 days with more room to fall in the coming days amid a potential sell-the-news event, such as the Merge.
Lido DAO Ether deposits surge 160% in 2022
Lido DAO is Ethereum’s biggest staking service, having deposited over 4.14 million of the blockchain’s native asset, Ether (ETH), into the Ethereum 2.0 smart contract on behalf of its users, according to the latest data.
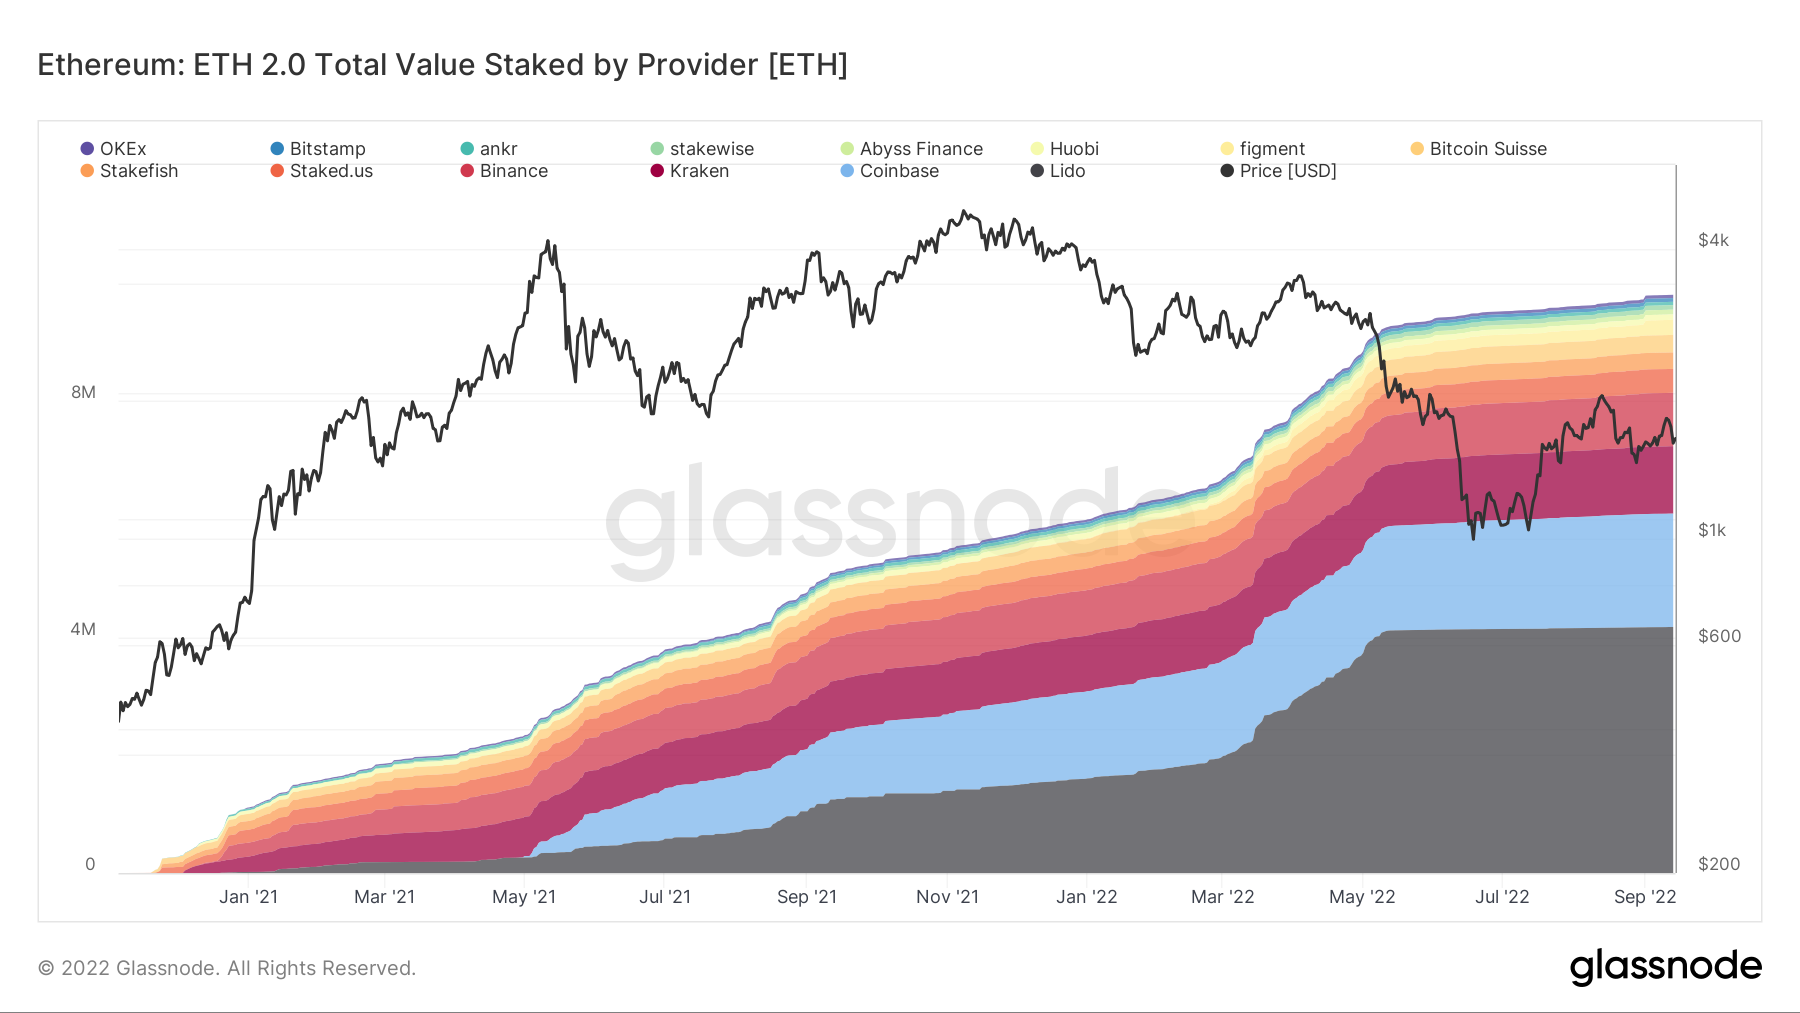
ETH 2.0 total value staked by provider. Source: Glassnode
In comparison, Lido DAO’s total staked amount was around 1.6 million ETH at the beginning of this year. The boom reflects a growing demand for Lido DAO services ahead of Ethereum’s scheduled transition from proof-of-work (PoW) to proof-of-stake (PoS) via the Merge on Sep. 15.
LDO, a governance token in the Lido DAO ecosystem, has also undergone an unprecedented price rally in recent months, up more than 350% after bottoming out at $0.39 in June.
Still, the token’s sharp correction in the past month raises the possibility of an extended downtrend now that the pre-Merge hype is nearing its end. In addition, a technical setup also alerts about a potential price decline ahead.
LDO hints at descending triangle reversal
The latest selling period in the Lido DAO market started after LDO topped at $3.10 on Aug. 13. This downtrend has painted a pattern that appears to be a descending triangle.
Descending triangles that form at the top suggest bullish exhaustion. Theoretically, a descending triangle breakdown below the lower trendline could crash the price to the level at length equal to the maximum triangle height.
LDO now tests the triangle’s lower trendline area, at around $1.79-$1.82, as support. The token could drop toward $1.17 if it breaks below the support level while accompanying a rise in trading volumes. In other words, a 35% drop from current price levels.
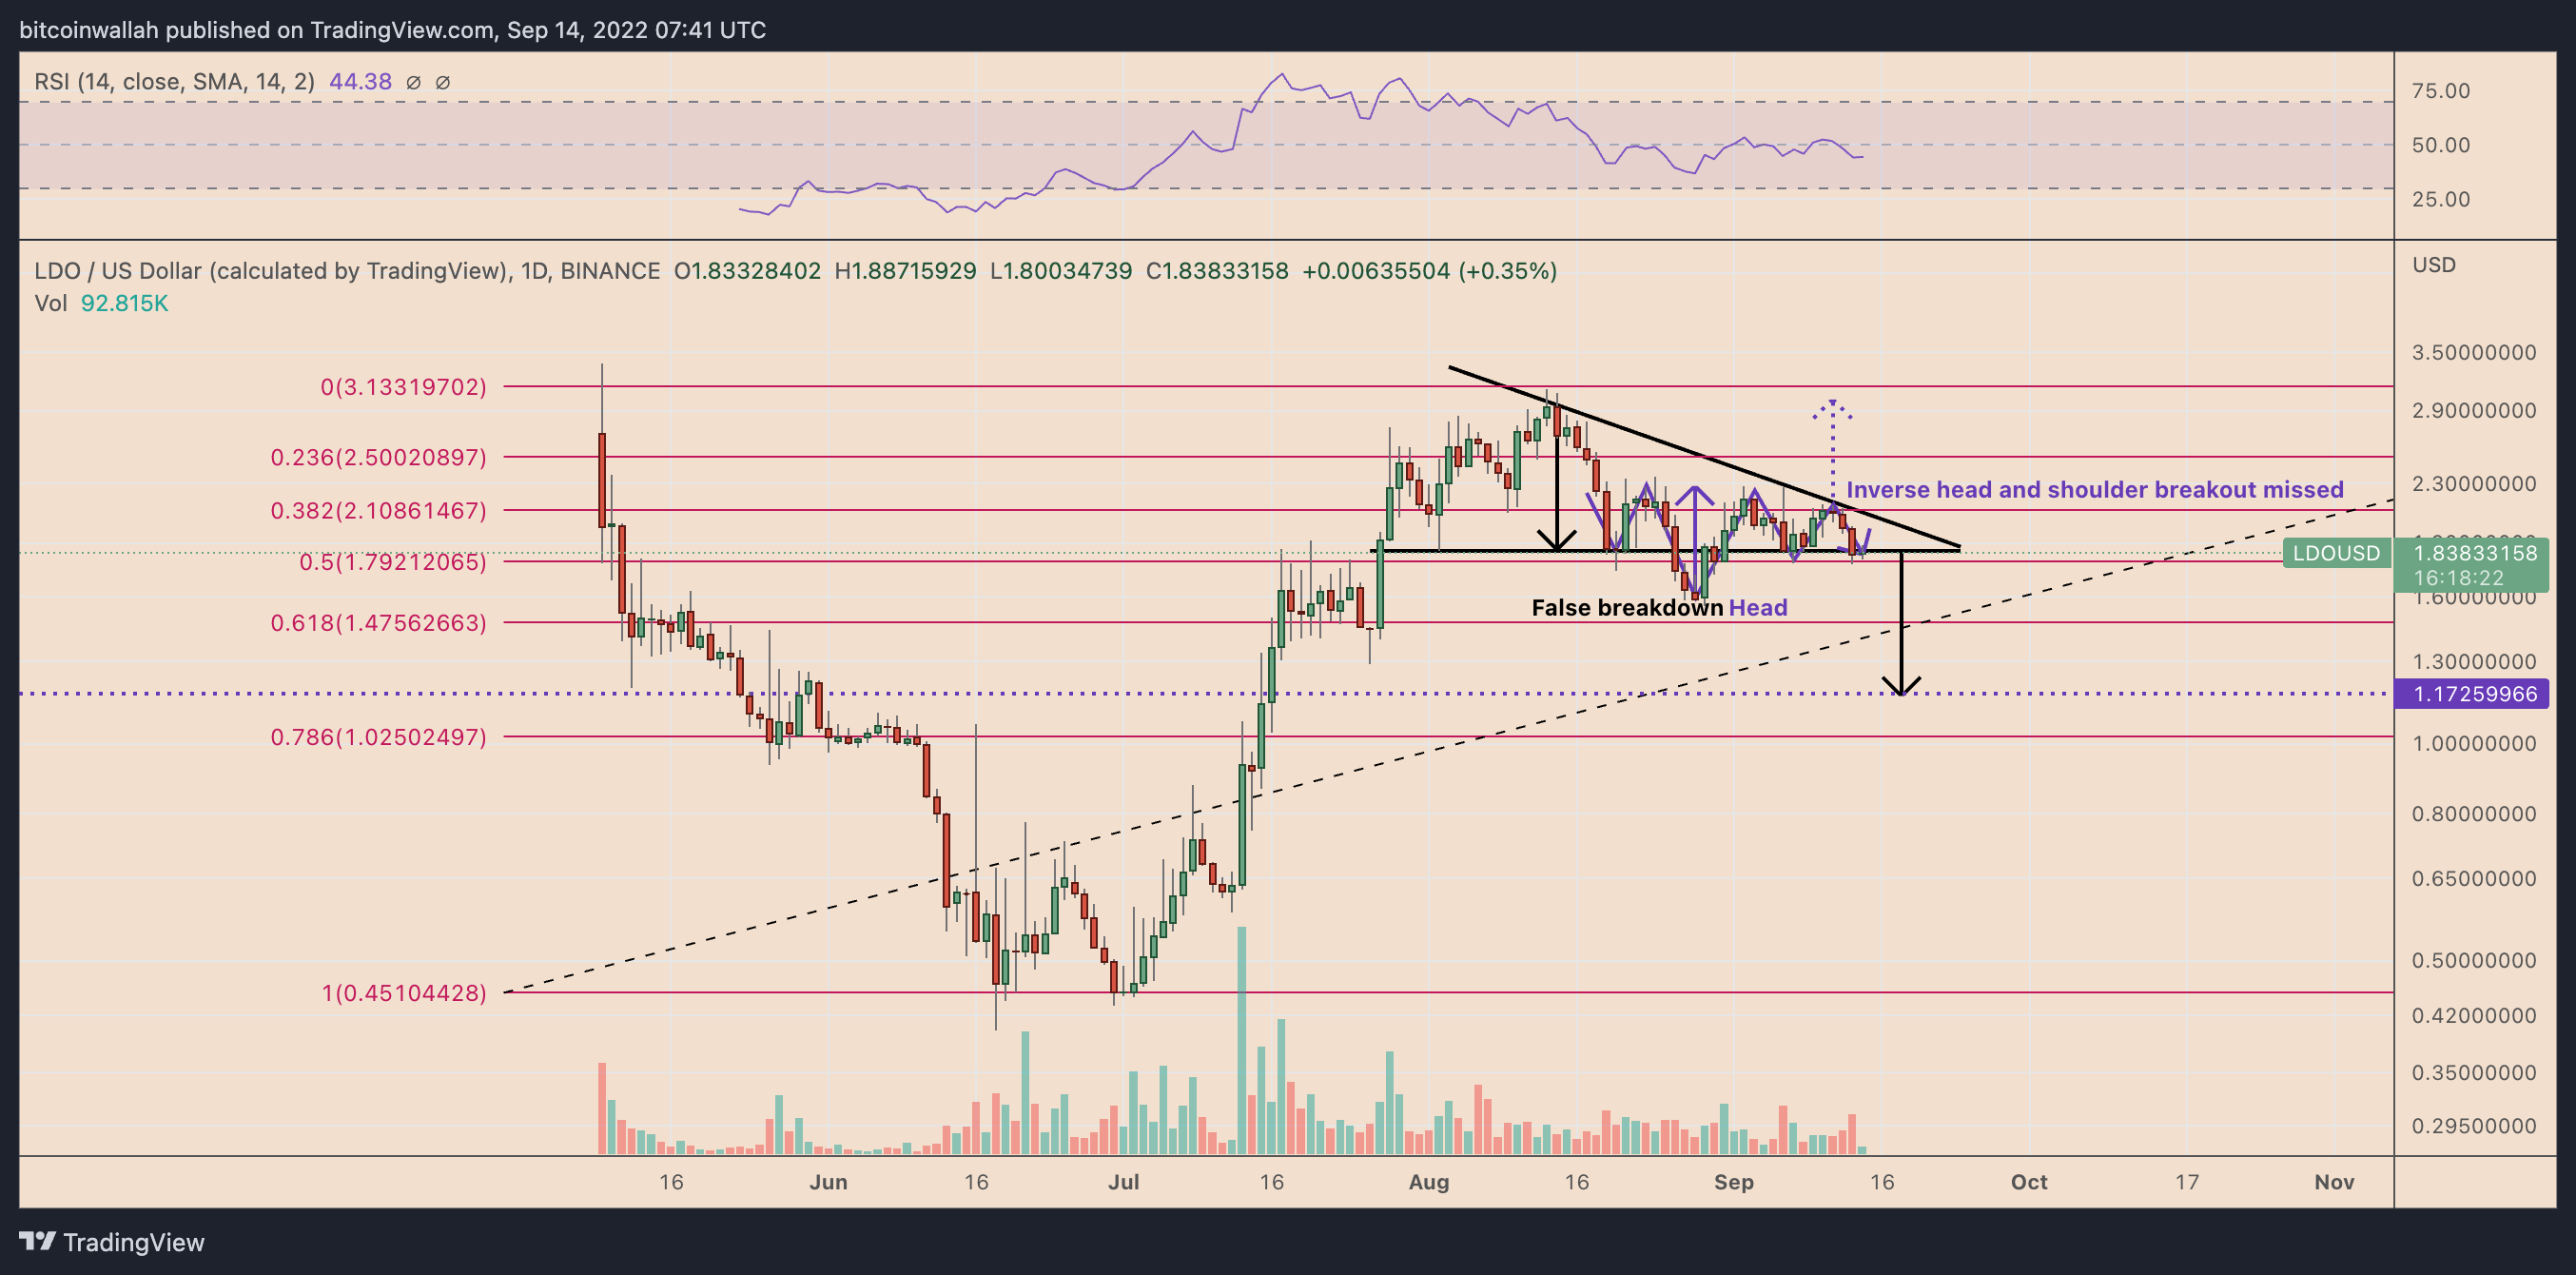
LDO/USD daily price chart featuring descending triangle breakdown setup. Source: TradingView
Conversely, a rebound from the $1.79-182 support area could have LDO test the descending triangle’s upper trendline at around $2.10 as resistance.
Also, a decisive breakout above the upper trendline would risk invalidating the bearish setup discussed above.
Information on these pages contains forward-looking statements that involve risks and uncertainties. Markets and instruments profiled on this page are for informational purposes only and should not in any way come across as a recommendation to buy or sell in these assets. You should do your own thorough research before making any investment decisions. FXStreet does not in any way guarantee that this information is free from mistakes, errors, or material misstatements. It also does not guarantee that this information is of a timely nature. Investing in Open Markets involves a great deal of risk, including the loss of all or a portion of your investment, as well as emotional distress. All risks, losses and costs associated with investing, including total loss of principal, are your responsibility. The views and opinions expressed in this article are those of the authors and do not necessarily reflect the official policy or position of FXStreet nor its advertisers.
Recommended Content
Editors’ Picks
Ripple update: XRP shows resilience in recent crypto market sell-off
Ripple's XRP is up 6% on Tuesday following a series of on-chain metrics, which reveals investors in the remittance-based token held onto their assets despite the wider crypto market sell-off last week.
Floki DAO floats liquidity provisioning for a Floki ETP in Europe
Floki DAO — the organization that manages the memecoin Floki — has proposed allocating a portion of its treasury to an asset manager in a bid to launch an exchange-traded product (ETP) in Europe, allowing institutional investors to gain exposure to the memecoin.

Six Bitcoin mutual funds to debut in Israel next week: Report
Six mutual funds tracking the price of bitcoin (BTC) will debut in Israel next week after the Israel Securities Authority (ISA) granted permission for the products, Calcalist reported on Wednesday.

Crypto Today: BTC hits new Trump-era low as Chainlink, HBAR and AAVE lead market recovery
The global cryptocurrency market cap shrank by $500 billion after the Federal Reserve's hawkish statements on December 17. Amid the market crash, Bitcoin price declined 7.2% last week, recording its first weekly timeframe loss since Donald Trump’s re-election.

Bitcoin: 2025 outlook brightens on expectations of US pro-crypto policy
Bitcoin price has surged more than 140% in 2024, reaching the $100K milestone in early December. The rally was driven by the launch of Bitcoin Spot ETFs in January and the reduced supply following the fourth halving event in April.

Best Forex Brokers with Low Spreads
VERIFIED Low spreads are crucial for reducing trading costs. Explore top Forex brokers offering competitive spreads and high leverage. Compare options for EUR/USD, GBP/USD, USD/JPY, and Gold.