- Sandbox price noted a 4.62% weekly decline in its price, SAND price is $0.4330 on Wednesday.
- Sandbox has scheduled an unlock of 205.59 million SAND tokens worth $88.31 million on February 14.
- SAND price dropped by 20% in the week following its previous token unlock event, a similar occurrence is likely this month.
Sandbox has scheduled a $88.31 million unlock on February 14. The token is currently in a downward trend and further decline is likely with the likely release of 205.59 million tokens in SAND’s circulating supply.
On-chain metrics support a bearish thesis for SAND and further correction in the metaverse token is likely.
Also read: XRP price at risk of further consolidation, Ripple requests an extension of deadline in SEC lawsuit
Sandbox on-chain metrics, scheduled events suggest SAND price correction is likely
Sandbox’s Active Addresses and Volume, two metrics used to determine user activity and the token’s demand among market participants, signal a correction in SAND. Since January 1, SAND’s Active Addresses and Volume have been in a downward trend, as seen in the Santiment chart below.
This indicates that user activity in Sandbox has dropped significantly, in the same timeframe.
 [12.17.42, 07 Feb, 2024]-638428872112574788.png)
SAND Active Addresses and Volume. Source: Santiment
Now turning to Sandbox’s Supply on Exchanges, this metric climbed from 380.3 million on February 1 to 466.05 million on Wednesday, at the time of writing. This marks a steep increase in SAND reserves on exchange wallets, meaning there is a relatively large volume of Sandbox tokens likely to be sold. There is a possibility of an increase in selling pressure on SAND, and this could drive the metaverse’s price lower.
 [12.14.44, 07 Feb, 2024]-638428872387678450.png)
Sandbox Supply on Exchanges and Price. Source: Santiment
According to data from tokenunlocks.app, the unlock of $88.31 million in SAND tokens is scheduled for February 14. A similar event where $130.26 million worth of the asset was unlocked in August 2023, drove the price down by nearly 20%. If the trend repeats, SAND price could suffer a nearly 20% decline in its price, within a week of the unlock.
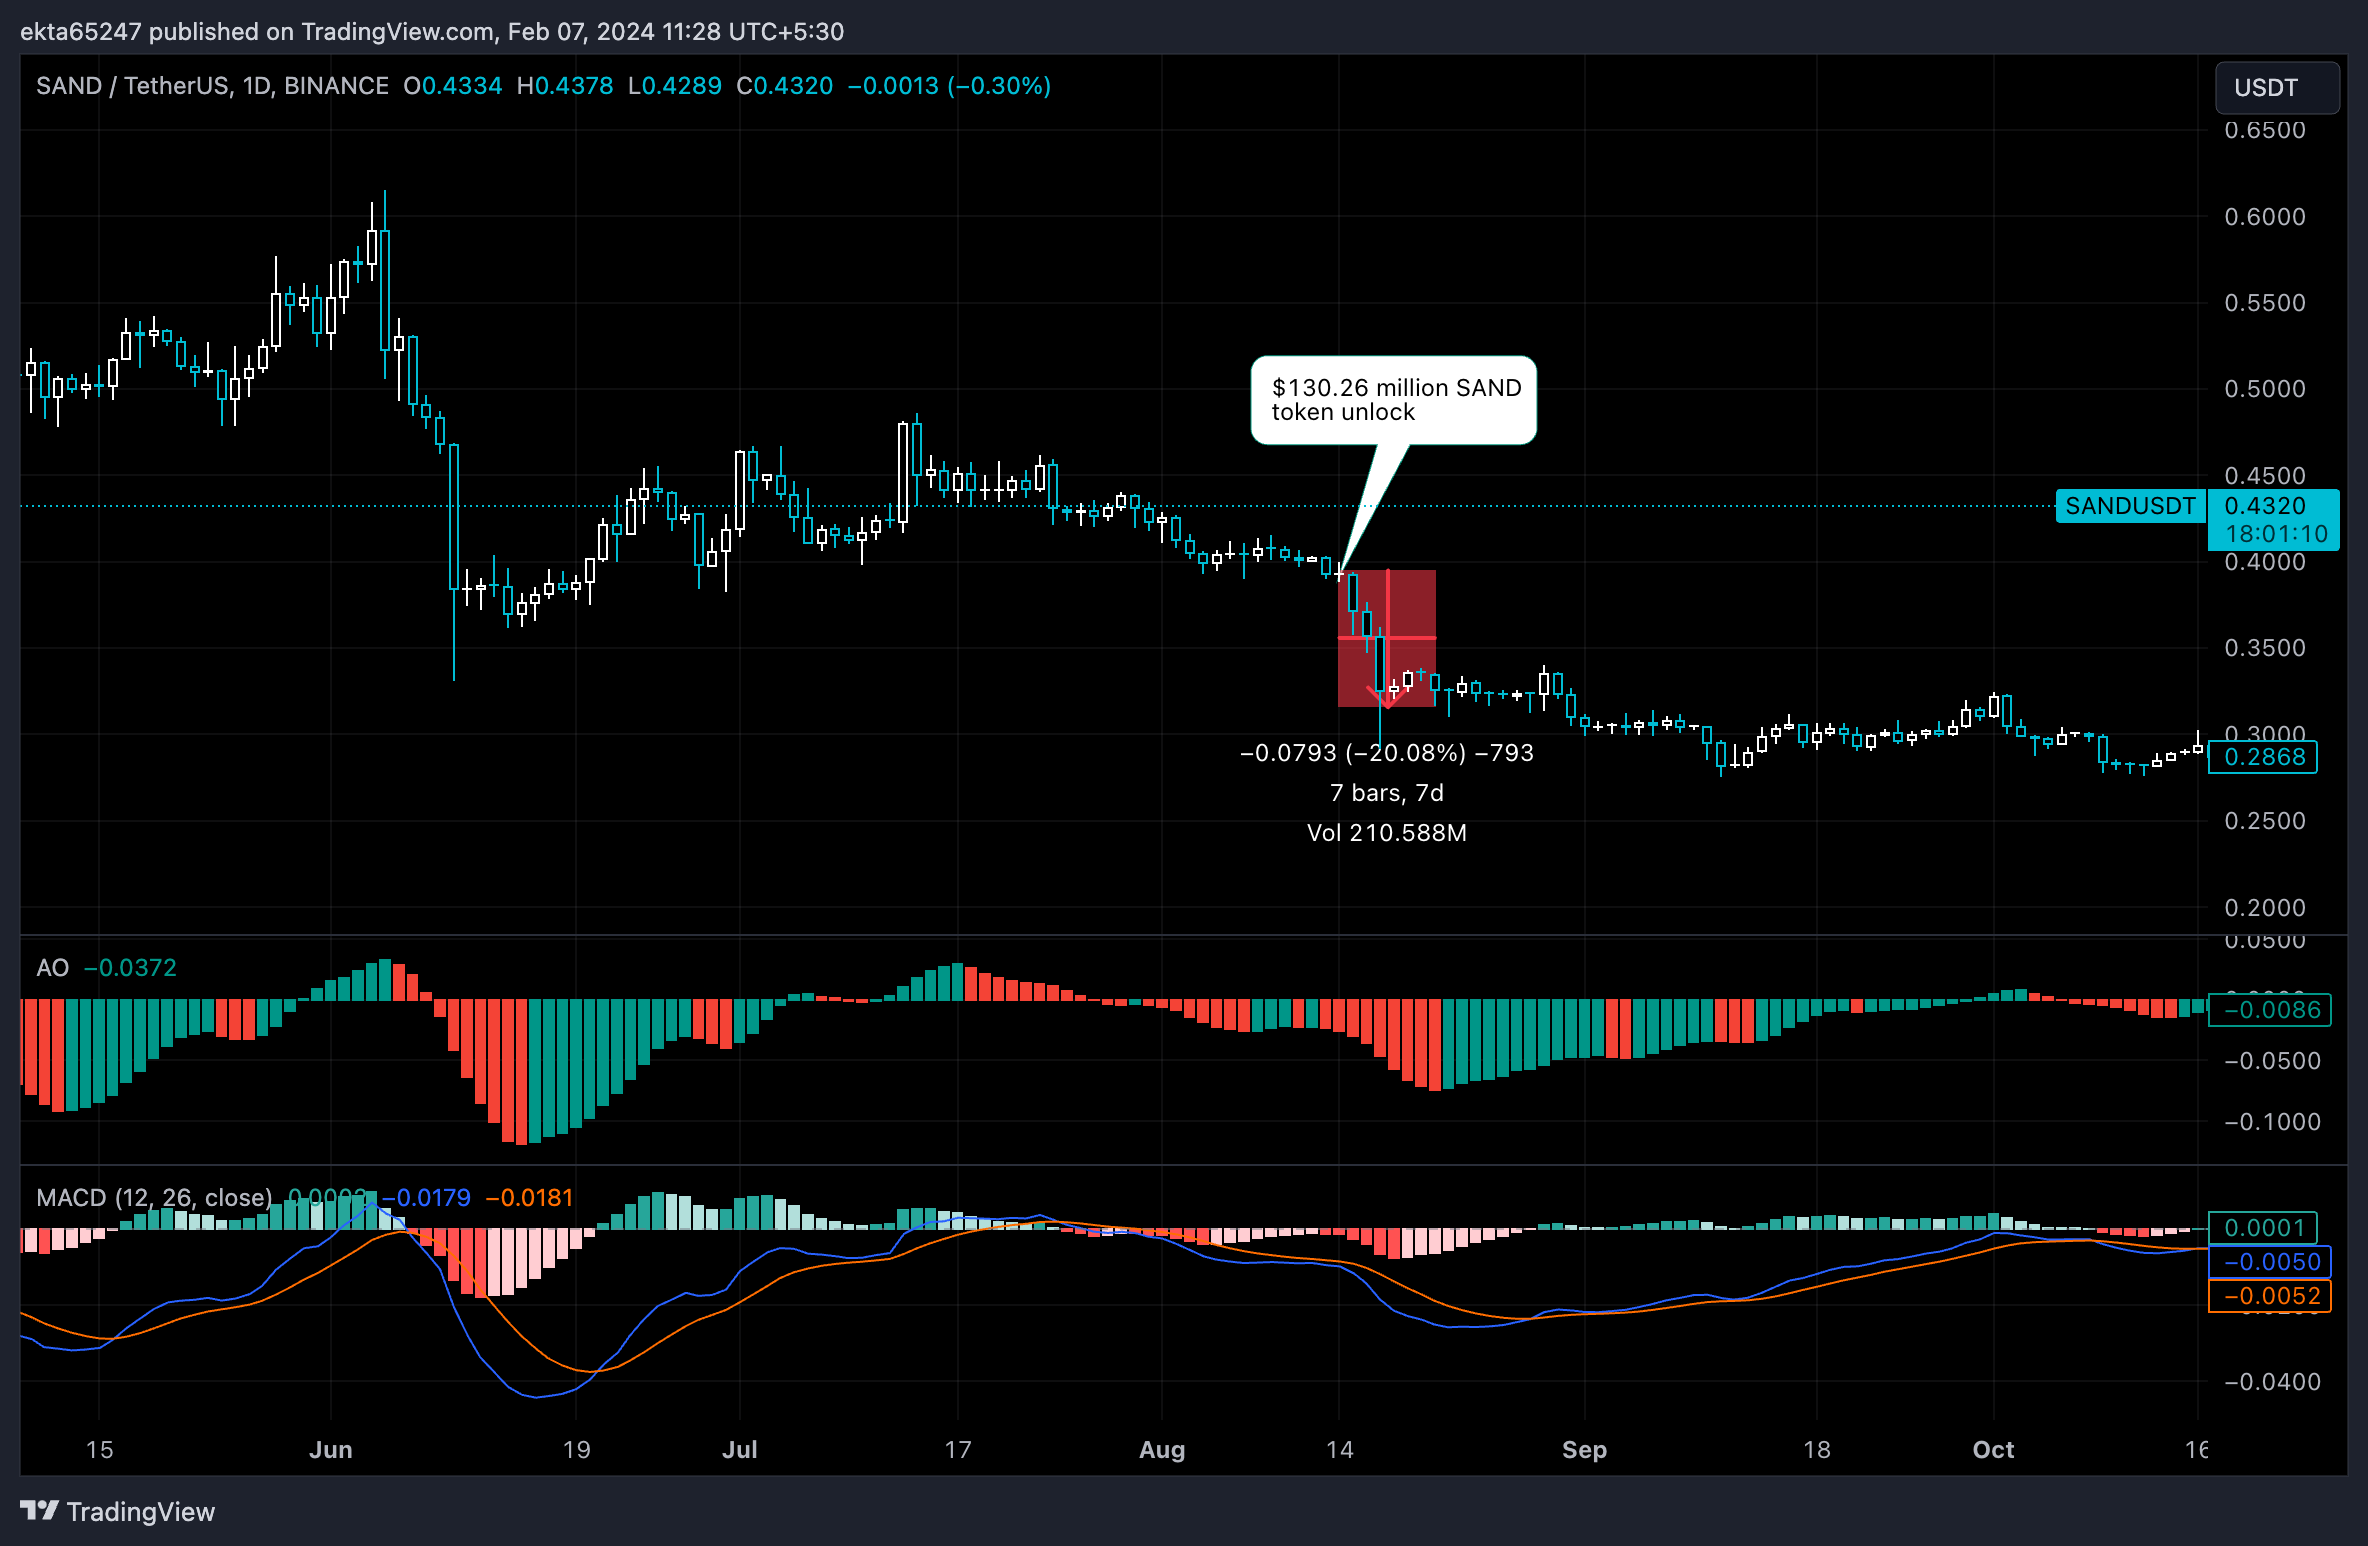
SAND/USDT 1-day chart
At the time of writing, SAND price is $0.4320 on Binance.
(This story was corrected on February 7 at 14:38 GMT to say that the SAND unlock is worth $88.31 million, not $94.42.)
Information on these pages contains forward-looking statements that involve risks and uncertainties. Markets and instruments profiled on this page are for informational purposes only and should not in any way come across as a recommendation to buy or sell in these assets. You should do your own thorough research before making any investment decisions. FXStreet does not in any way guarantee that this information is free from mistakes, errors, or material misstatements. It also does not guarantee that this information is of a timely nature. Investing in Open Markets involves a great deal of risk, including the loss of all or a portion of your investment, as well as emotional distress. All risks, losses and costs associated with investing, including total loss of principal, are your responsibility. The views and opinions expressed in this article are those of the authors and do not necessarily reflect the official policy or position of FXStreet nor its advertisers. The author will not be held responsible for information that is found at the end of links posted on this page.
If not otherwise explicitly mentioned in the body of the article, at the time of writing, the author has no position in any stock mentioned in this article and no business relationship with any company mentioned. The author has not received compensation for writing this article, other than from FXStreet.
FXStreet and the author do not provide personalized recommendations. The author makes no representations as to the accuracy, completeness, or suitability of this information. FXStreet and the author will not be liable for any errors, omissions or any losses, injuries or damages arising from this information and its display or use. Errors and omissions excepted.
The author and FXStreet are not registered investment advisors and nothing in this article is intended to be investment advice.
Recommended Content
Editors’ Picks

Bitcoin Weekly Forecast: BTC nosedives below $95,000 as spot ETFs record highest daily outflow since launch
Bitcoin price continues to edge down, trading below $95,000 on Friday after declining more than 9% this week. Bitcoin US spot ETFs recorded the highest single-day outflow on Thursday since their launch in January.

Bitcoin crashes to $96,000, altcoins bleed: Top trades for sidelined buyers
Bitcoin (BTC) slipped under the $100,000 milestone and touched the $96,000 level briefly on Friday, a sharp decline that has also hit hard prices of other altcoins and particularly meme coins.

Solana Price Forecast: SOL’s technical outlook and on-chain metrics hint at a double-digit correction
Solana (SOL) price trades in red below $194 on Friday after declining more than 13% this week. The recent downturn has led to $38 million in total liquidations, with over $33 million coming from long positions.

SEC approves Hashdex and Franklin Templeton's combined Bitcoin and Ethereum crypto index ETFs
The SEC approved Hashdex's proposal for a crypto index ETF. The ETF currently features Bitcoin and Ethereum, with possible additions in the future. The agency also approved Franklin Templeton's amendment to its Cboe BZX for a crypto index ETF.

Bitcoin: 2025 outlook brightens on expectations of US pro-crypto policy
Bitcoin (BTC) price has surged more than 140% in 2024, reaching the $100K milestone in early December. The rally was driven by the launch of Bitcoin Spot Exchange Traded Funds (ETFs) in January and the reduced supply following the fourth halving event in April.

Best Forex Brokers with Low Spreads
VERIFIED Low spreads are crucial for reducing trading costs. Explore top Forex brokers offering competitive spreads and high leverage. Compare options for EUR/USD, GBP/USD, USD/JPY, and Gold.