- Sandbox price starts to fade for a second day as investors cash in on their gains.
- SAND price looks to fall back towards the monthly pivot as dark clouds form in global markets.
- Expect Sandbox prices to look for support to reboot the rally with fresh buyers.
Sandbox (SAND) has been on the back foot for a second day now as global markets start to worry about the Omicron variant becoming the dominant strain, surpassing Delta in the number of contaminations. Investors are starting to pull out their money, which could leadSAND to pull back to $5.70.
Sandbox set to correct 10% intraday
Sandbox was in a sweet spot these past few days as investors enjoyed a 40% gain in price action, with the Christmas rally lifting sentiment. That same sentiment is taking a turn today as price action in SAND starts to fade a little too much with bulls looking for support. That first initial support is still 10% from the current price action.
Expect SAND to dip further throughout the day toward the monthly pivot near $5.70, with the monthly pivot coming into play. If that level does not trick, investors will want to look for the intersection from the blue ascending trend line with the yellow descending trend line, making it a perfect entry-level to go long.
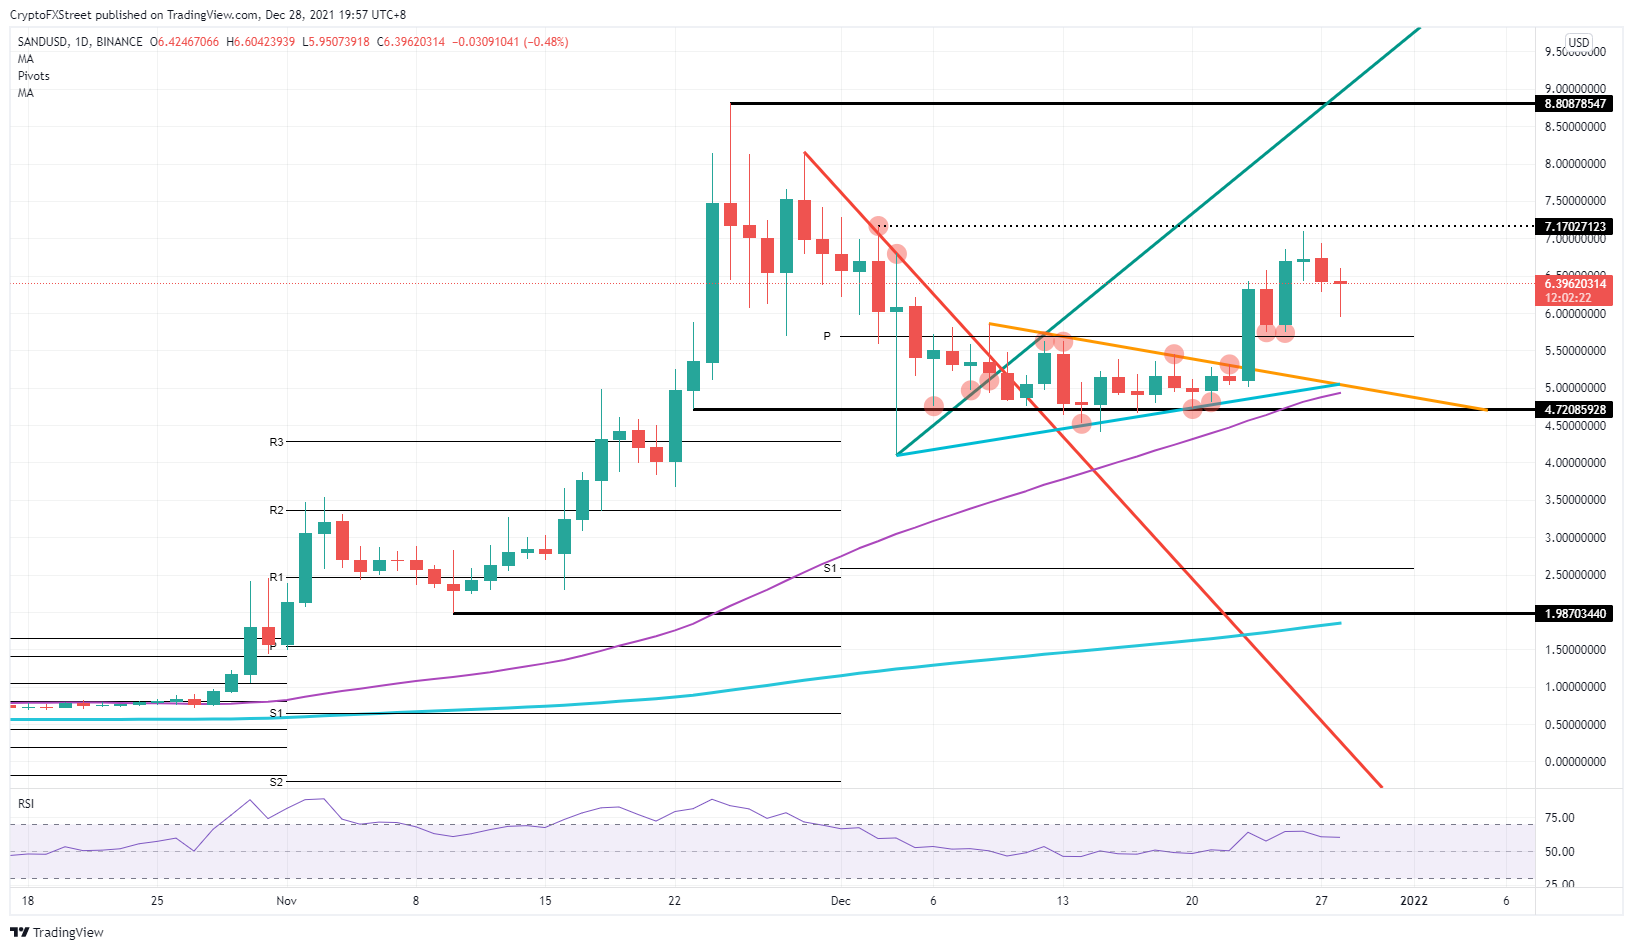
SAND/USD daily chart
As volumes these coming days are pretty thin, sentiment could shift quickly back into risk-on and see a retest of the $7.17 level, with a possible break above. Once there, investors will want to get in the price action again and jump on the bullish signals. That could easily see price action ranging from $7.17 to $8.80 and possibly to new all-time highs, but that would be in tandem with stock markets making new highs.
Information on these pages contains forward-looking statements that involve risks and uncertainties. Markets and instruments profiled on this page are for informational purposes only and should not in any way come across as a recommendation to buy or sell in these assets. You should do your own thorough research before making any investment decisions. FXStreet does not in any way guarantee that this information is free from mistakes, errors, or material misstatements. It also does not guarantee that this information is of a timely nature. Investing in Open Markets involves a great deal of risk, including the loss of all or a portion of your investment, as well as emotional distress. All risks, losses and costs associated with investing, including total loss of principal, are your responsibility. The views and opinions expressed in this article are those of the authors and do not necessarily reflect the official policy or position of FXStreet nor its advertisers. The author will not be held responsible for information that is found at the end of links posted on this page.
If not otherwise explicitly mentioned in the body of the article, at the time of writing, the author has no position in any stock mentioned in this article and no business relationship with any company mentioned. The author has not received compensation for writing this article, other than from FXStreet.
FXStreet and the author do not provide personalized recommendations. The author makes no representations as to the accuracy, completeness, or suitability of this information. FXStreet and the author will not be liable for any errors, omissions or any losses, injuries or damages arising from this information and its display or use. Errors and omissions excepted.
The author and FXStreet are not registered investment advisors and nothing in this article is intended to be investment advice.
Recommended Content
Editors’ Picks

Bitcoin Weekly Forecast: BTC nosedives below $95,000 as spot ETFs record highest daily outflow since launch
Bitcoin price continues to edge down, trading below $95,000 on Friday after declining more than 9% this week. Bitcoin US spot ETFs recorded the highest single-day outflow on Thursday since their launch in January.

Bitcoin crashes to $96,000, altcoins bleed: Top trades for sidelined buyers
Bitcoin (BTC) slipped under the $100,000 milestone and touched the $96,000 level briefly on Friday, a sharp decline that has also hit hard prices of other altcoins and particularly meme coins.

Solana Price Forecast: SOL’s technical outlook and on-chain metrics hint at a double-digit correction
Solana (SOL) price trades in red below $194 on Friday after declining more than 13% this week. The recent downturn has led to $38 million in total liquidations, with over $33 million coming from long positions.

SEC approves Hashdex and Franklin Templeton's combined Bitcoin and Ethereum crypto index ETFs
The SEC approved Hashdex's proposal for a crypto index ETF. The ETF currently features Bitcoin and Ethereum, with possible additions in the future. The agency also approved Franklin Templeton's amendment to its Cboe BZX for a crypto index ETF.

Bitcoin: 2025 outlook brightens on expectations of US pro-crypto policy
Bitcoin (BTC) price has surged more than 140% in 2024, reaching the $100K milestone in early December. The rally was driven by the launch of Bitcoin Spot Exchange Traded Funds (ETFs) in January and the reduced supply following the fourth halving event in April.

Best Forex Brokers with Low Spreads
VERIFIED Low spreads are crucial for reducing trading costs. Explore top Forex brokers offering competitive spreads and high leverage. Compare options for EUR/USD, GBP/USD, USD/JPY, and Gold.