- The Sandbox price has seen a sharp fade after bulls failed to reclaim the 38.2% Fibonacci level.
- SAND even risked further tanking as price action broke the 50% Fibonacci level to the downside.
- With tailwinds emerging at the late end of last week, sentiment looks to return in favor of the bulls, reclaiming 38.2% Fibonacci level with new highs for the taking.
The Sandbox (SAND) has undergone a heavy paring back of the gains after hitting all-time highs at the end of November. With bulls trying to reclaim the lost levels, a bull trap almost formed. With the shift in global sentiment and tailwinds emerging back in cryptocurrencies, bulls got saved at the last minute and are now reclaiming significant strategic levels to the upside with the 38.2% Fibonacci level as key before trying to make new all-time highs.
SAND bulls are reclaiming strategic levels for new highs
The Sandbox saw investors fleeing the scene after profit-taking sparked a significant fade to the downside at the end of November. As bulls tried to return to those all-time highs, a bull trap almost got formed with bulls getting squeezed out of their positions, entering at the 38.2% Fibonacci level around $5.69 and getting stopped out at the 50% Fibonacci level near $4.72. But the turn in sentiment this week, coming from the US central bank, saved their strategy.
SAND sees bulls bouncing off that 50% Fibonacci level and pushing back towards 38.2% Fibonacci level to keep new all-time highs insight. Do not expect this to happen overnight as investors will want to spread their investments across several cryptocurrencies, as the current tailwinds are putting overall cryptocurrencies on the front foot. Going into Christmas and year-end, expect a squeeze to the upside with new all-time highs in the making.
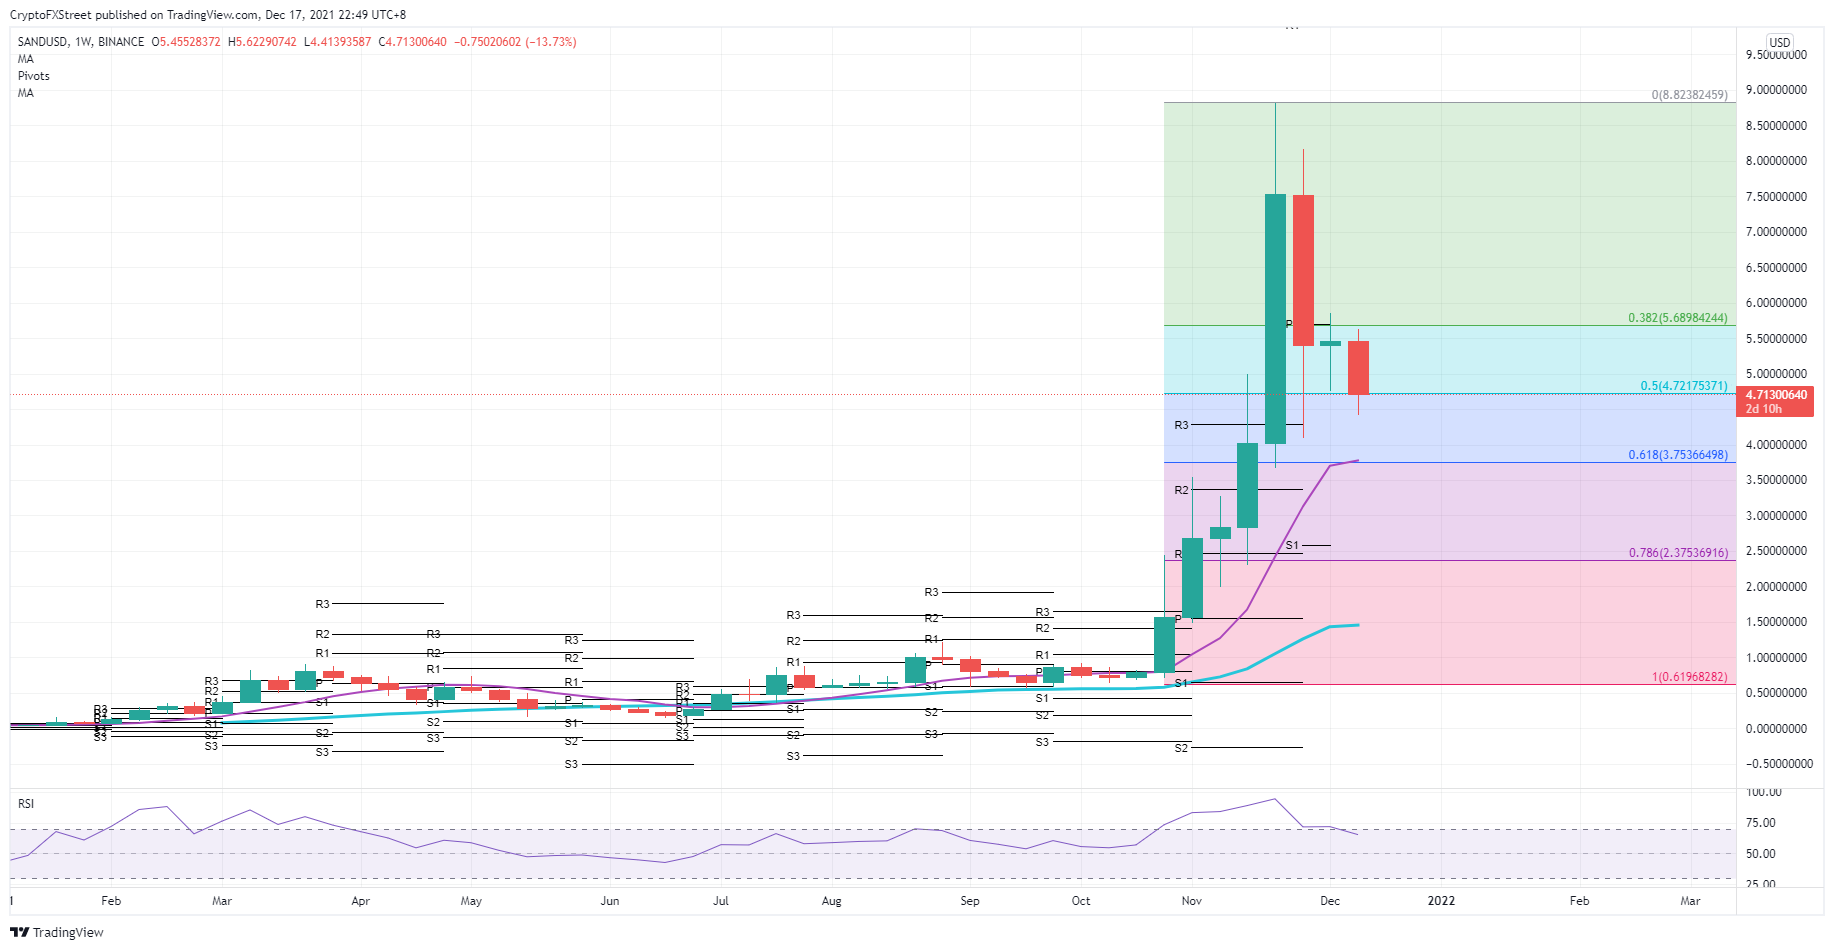
SAND/USD weekly chart
The risk that comes with the last two weeks in the year for trading is thin liquidity. A shock could come from some institutional investors that are pulling their money out over the holiday season, triggering a global selloff in cryptocurrencies as retail investors will want to get out as well. In that case, expect SAND price action to give way to the 50% Fibonacci level at $4.72 and see a further downtick towards the %61.8 Fibonacci level at $3.75. That level should come as interest for investors as it holds the 55-day Simple Moving Average, which makes the level additionally attractive for investors to engage.
Information on these pages contains forward-looking statements that involve risks and uncertainties. Markets and instruments profiled on this page are for informational purposes only and should not in any way come across as a recommendation to buy or sell in these assets. You should do your own thorough research before making any investment decisions. FXStreet does not in any way guarantee that this information is free from mistakes, errors, or material misstatements. It also does not guarantee that this information is of a timely nature. Investing in Open Markets involves a great deal of risk, including the loss of all or a portion of your investment, as well as emotional distress. All risks, losses and costs associated with investing, including total loss of principal, are your responsibility. The views and opinions expressed in this article are those of the authors and do not necessarily reflect the official policy or position of FXStreet nor its advertisers. The author will not be held responsible for information that is found at the end of links posted on this page.
If not otherwise explicitly mentioned in the body of the article, at the time of writing, the author has no position in any stock mentioned in this article and no business relationship with any company mentioned. The author has not received compensation for writing this article, other than from FXStreet.
FXStreet and the author do not provide personalized recommendations. The author makes no representations as to the accuracy, completeness, or suitability of this information. FXStreet and the author will not be liable for any errors, omissions or any losses, injuries or damages arising from this information and its display or use. Errors and omissions excepted.
The author and FXStreet are not registered investment advisors and nothing in this article is intended to be investment advice.
Recommended Content
Editors’ Picks

Bitcoin Weekly Forecast: BTC nosedives below $95,000 as spot ETFs record highest daily outflow since launch
Bitcoin price continues to edge down, trading below $95,000 on Friday after declining more than 9% this week. Bitcoin US spot ETFs recorded the highest single-day outflow on Thursday since their launch in January.

Bitcoin crashes to $96,000, altcoins bleed: Top trades for sidelined buyers
Bitcoin (BTC) slipped under the $100,000 milestone and touched the $96,000 level briefly on Friday, a sharp decline that has also hit hard prices of other altcoins and particularly meme coins.

Solana Price Forecast: SOL’s technical outlook and on-chain metrics hint at a double-digit correction
Solana (SOL) price trades in red below $194 on Friday after declining more than 13% this week. The recent downturn has led to $38 million in total liquidations, with over $33 million coming from long positions.

SEC approves Hashdex and Franklin Templeton's combined Bitcoin and Ethereum crypto index ETFs
The SEC approved Hashdex's proposal for a crypto index ETF. The ETF currently features Bitcoin and Ethereum, with possible additions in the future. The agency also approved Franklin Templeton's amendment to its Cboe BZX for a crypto index ETF.

Bitcoin: 2025 outlook brightens on expectations of US pro-crypto policy
Bitcoin (BTC) price has surged more than 140% in 2024, reaching the $100K milestone in early December. The rally was driven by the launch of Bitcoin Spot Exchange Traded Funds (ETFs) in January and the reduced supply following the fourth halving event in April.

Best Forex Brokers with Low Spreads
VERIFIED Low spreads are crucial for reducing trading costs. Explore top Forex brokers offering competitive spreads and high leverage. Compare options for EUR/USD, GBP/USD, USD/JPY, and Gold.