SafeMoon starts to look muted as it struggles to advance further
- SafeMoon has been in consolidation since August 16.
- Price is getting squeezed to the downside by two moving averages.
- Upside looks limited as investors plan where to get in.

SafeMoon price (SAFEMOON) has been in consolidation mode since August 16, when price action bottomed out at $0.00000117. A green ascending trend line started to form. That this trend line is of importance got proven on August 29, 30 and 31 as price action was supported each time by that same trend line.
This goes in favor of buyers who have this trend line marked up as a good entry level and supportive of price action. The upside looks muted though. On August 28, SafeMoon price hit a speed bump during the surge that coincided with the release of its new wallet and got rejected at $0.00000400. Not only does this level act as a psychological level, but it is also a mark on the red descending trend line originating from May 22.
SafeMoon buyers defend support
Between where price action is now, around $0.00000240, and the possible upside potential toward the red descending trend line is 61%. Buyers have excellent possible profit potential insight indeed. SafeMoon is making it difficult for buyers to still believe in that trade as several Simple Moving Averages (SMAs) are starting to form a death cross. The 5-day SMA is on the cusp of breaking the 10-day SMA to the downside – a preview of the famous death cross.
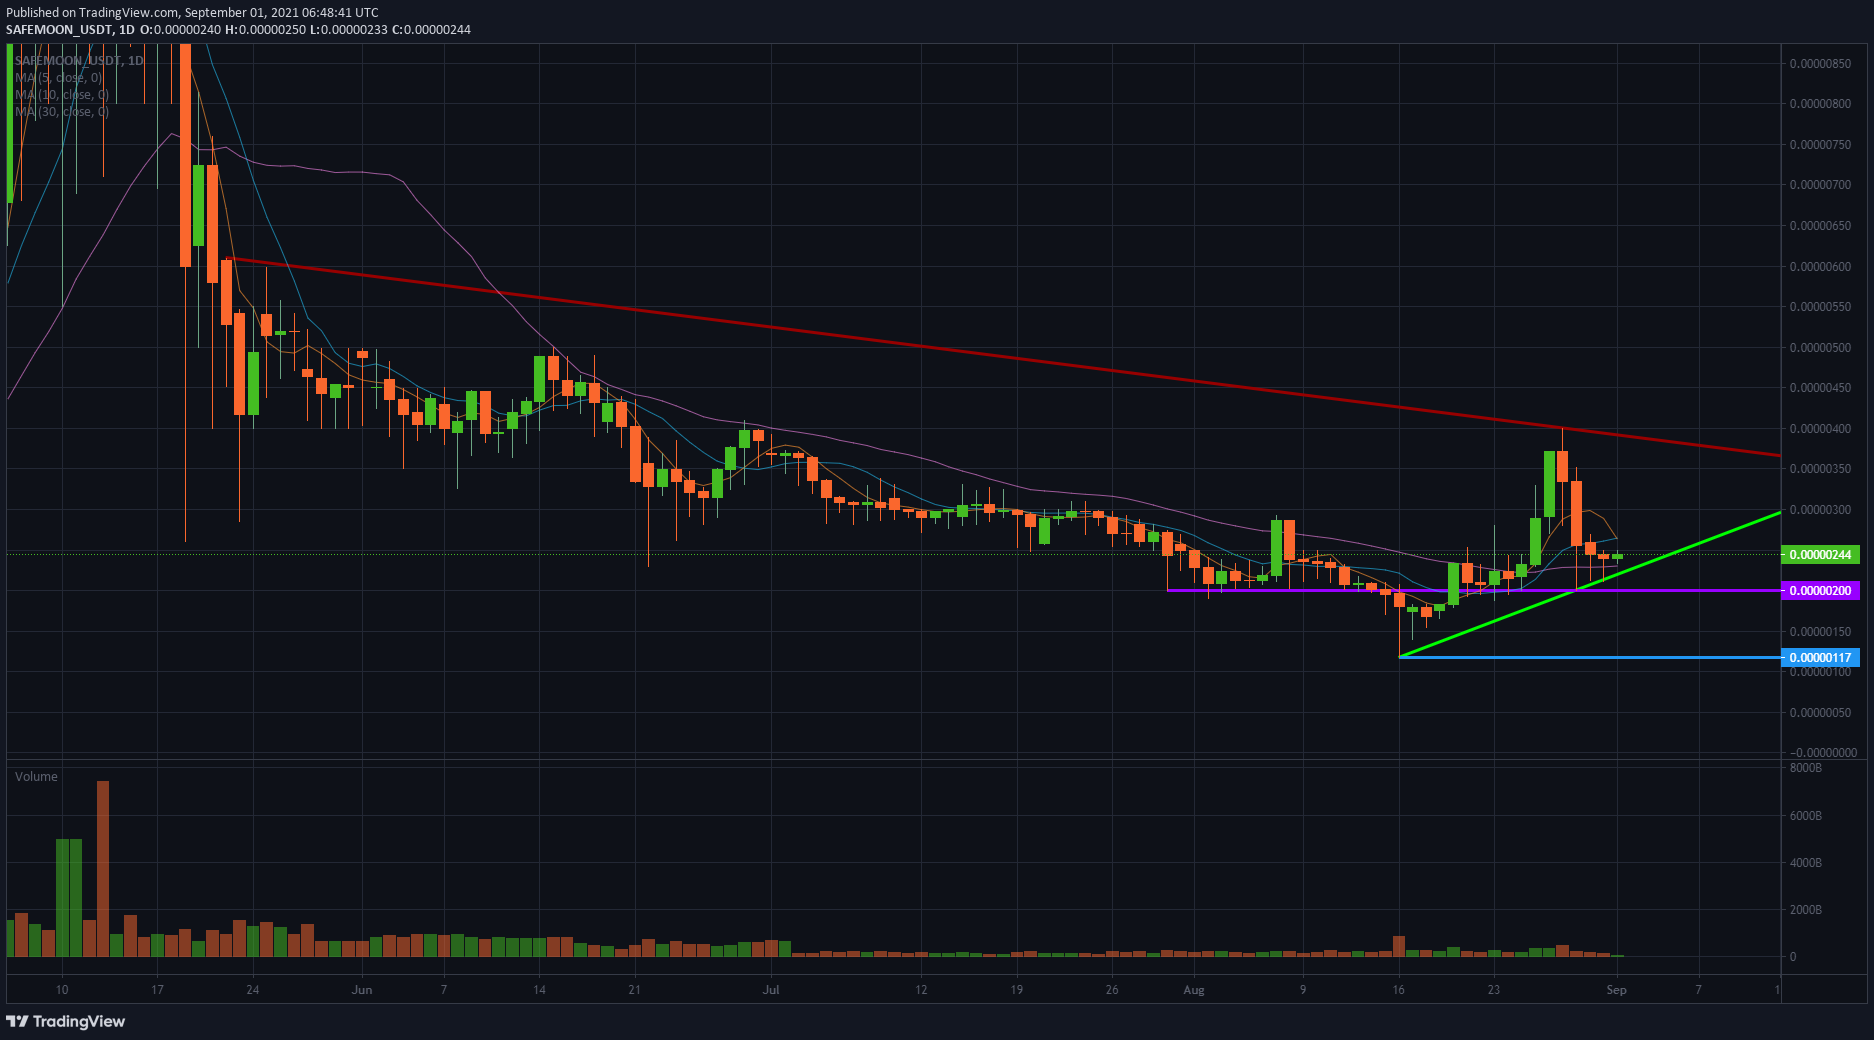
SAFEMOON/USD daily chart
Look for a break higher above those two SMAs. That will be key to see if the trend is still solid and in play. If the green ascending trend line breaks, expect the first test on $0.00000200, but that has already been chopped up quite often, so it will almost be inevitable that price action will want to test $0.00000117, taking us back to the August 16 low.
In case buyers fully regain control and decide to step out of the consolidation sooner, expect a break of the red descending trend line and a retest of that $0.00000400 marker.
Author

Filip Lagaart
FXStreet
Filip Lagaart is a former sales/trader with over 15 years of financial markets expertise under its belt.


