SafeMoon price traps bulls before another downswing
- SafeMoon price action slips below important areas and could be set for more pain to come.
- SAFEMOON price action sees bears showing their force in the chart these past few days.
- Expect to see more pressure to mount in a bearish breakout towards $0.001059070, printing a new low for March.

SafeMoon ( SAFEMOON) price action is on the back foot again, although cryptocurrencies in general are faring well after positive news on talks between Russia and Ukraine. SafeMoon price action looks to be an outlier with bears in the driving seat and not yet set to give up on their positions. As bearish pressure, further mounts, expect to see a drop of around 10%, which coincides with the low of February.
SafeMoon price set to drop another 10%
SafeMoon price action has slid further to the downside since the beginning of March. A close look at the charts and the shape of the candles shows how forceful bears are being, in terms of price action. With the tops of each candle all but flat and no room for bulls to push price beyond the opening price, bulls now appear remarkably absent from the market and bears are in control, pushing price action further down. This won’t stop until bulls show up again to halt the downturn.
SAFEMOON price action has thus dropped below the critical $0.001223648 level, which is the 23.6% Fibonacci level. To make matters even worse, SafeMoon price has slid through the low of February 28 at $0.001189572 and during the weekend saw a firm rejection by the level when bulls tried to break back above it. Expect to see the price dip further towards $0.001059070, printing new lows for March and possibly even for the year if the price tanks further.
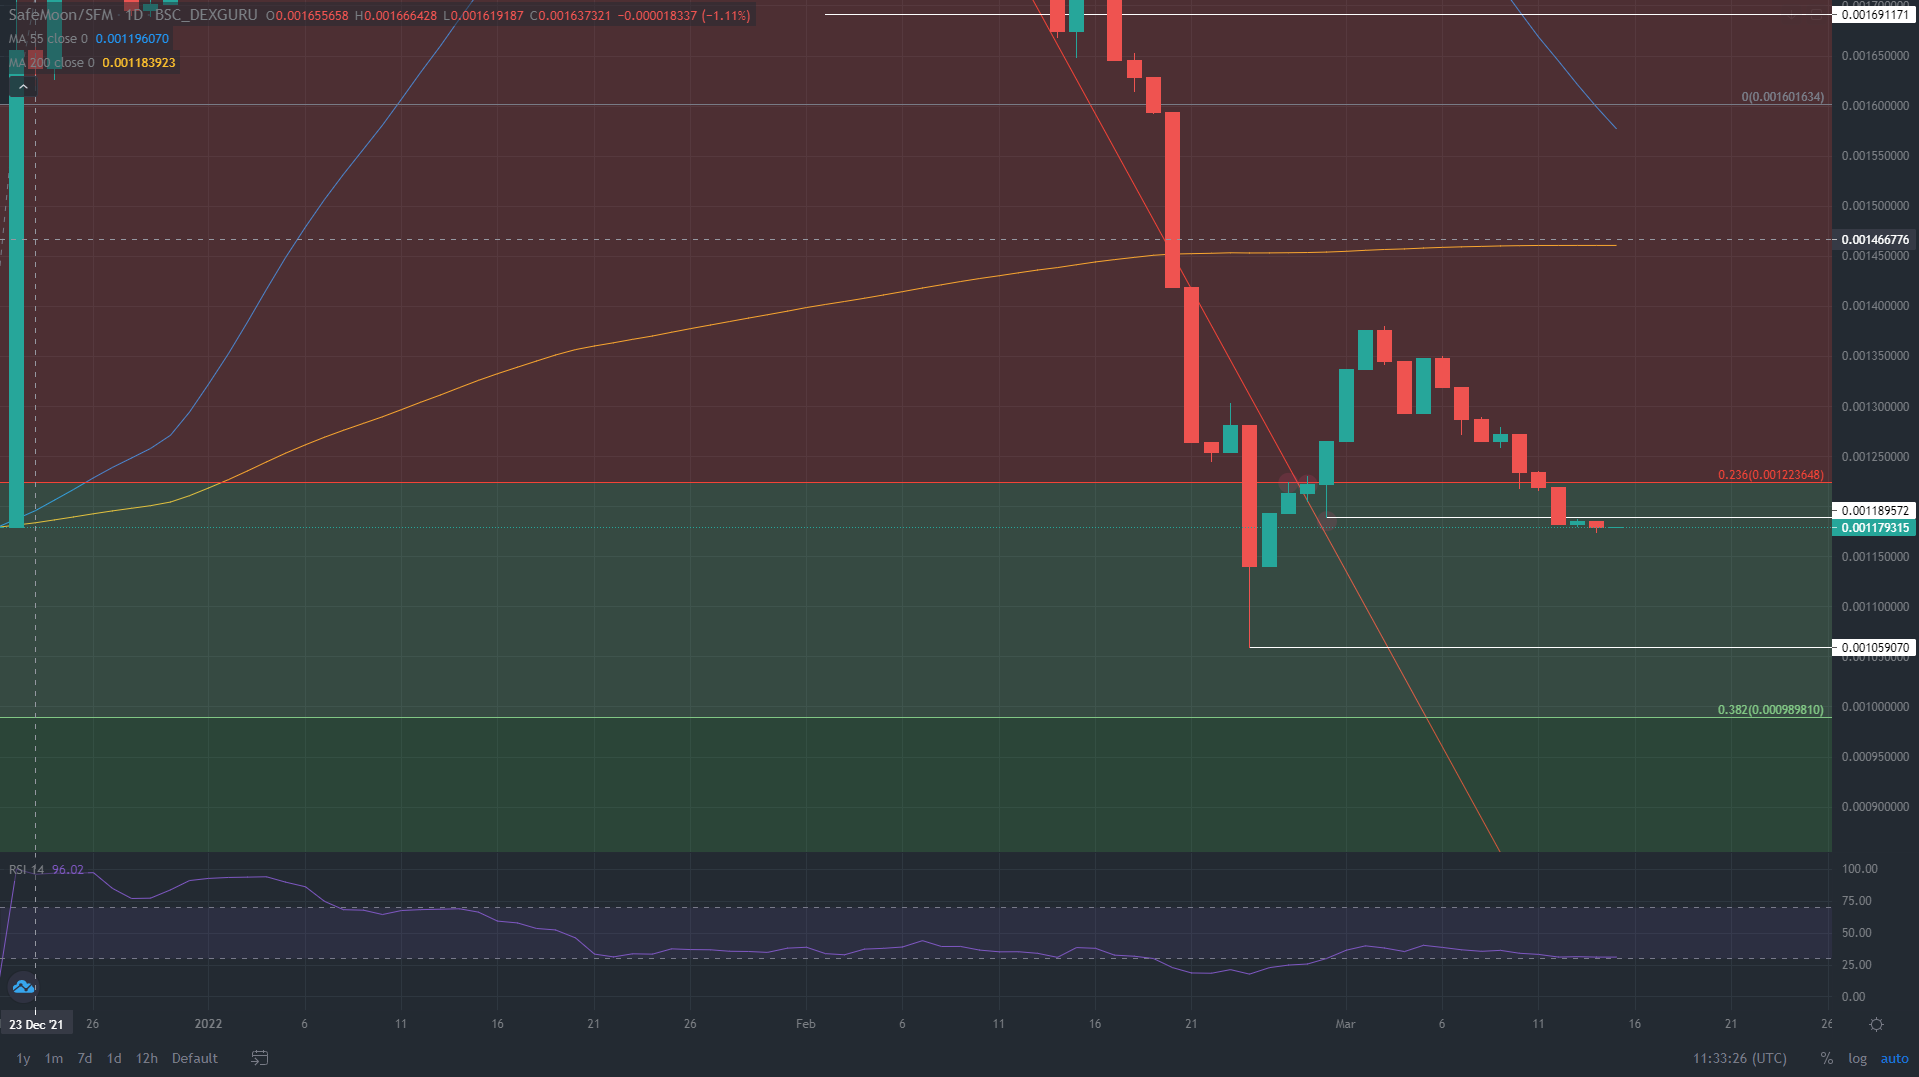
SAFEMOON/USD daily chart
As more and more groundwork is laid for peace talks, it looks like a deal could be brokered soon. That could see an influx of bulls back into the market, driving up the demand-side and resulting in price action shooting through the 23.6% Fibonacci level again. From there, the upside target would be $0.001379905, which is the high of March, with a possible attempt to overshoot that target to $0.001456809.
Author

Filip Lagaart
FXStreet
Filip Lagaart is a former sales/trader with over 15 years of financial markets expertise under its belt.


