- SafeMoon is on the verge of breaking the $0.00000178 Fibonacci level to the downside.
- Continuing push to the downside spells more downside to come.
- Already eight consecutive days of sellers in overall volume show sellers are in control of the price action in SafeMoon.
SafeMoon is continuing its downward trajectory today for eight consecutive days in a row. Price action is looking tilted to the downside with several factors in favor of more downside.
The red ascending trend line originating from August 28 is acting as the backbone for further downside. Although buyers have tried to break the trend line to the upside, the 23.6% Fibonacci retracement level looked too heavy for buyers to hold against sellers’ volume. With the triple top formation at $0.00000352 and the 23.6% Fibonacci retracement level at $0.00000333, buyers are aware that they face limited upside potential if they ever succeed in pushing SafeMoon to the upside.
SafeMoon will break $0.00000178, and that opens the door for more downside
Buyers can try to hold $0.00000178, the 78.6% Fibonacci retracement level, but that got broken already yesterday. This level had already lost most of its strength yesterday. Adding to the momentum is the 5-day Simple Moving Average (SMA), crossing the 30-day SMA to the downside and forming a death cross. It looks like more momentum is building for a further push to the downside.
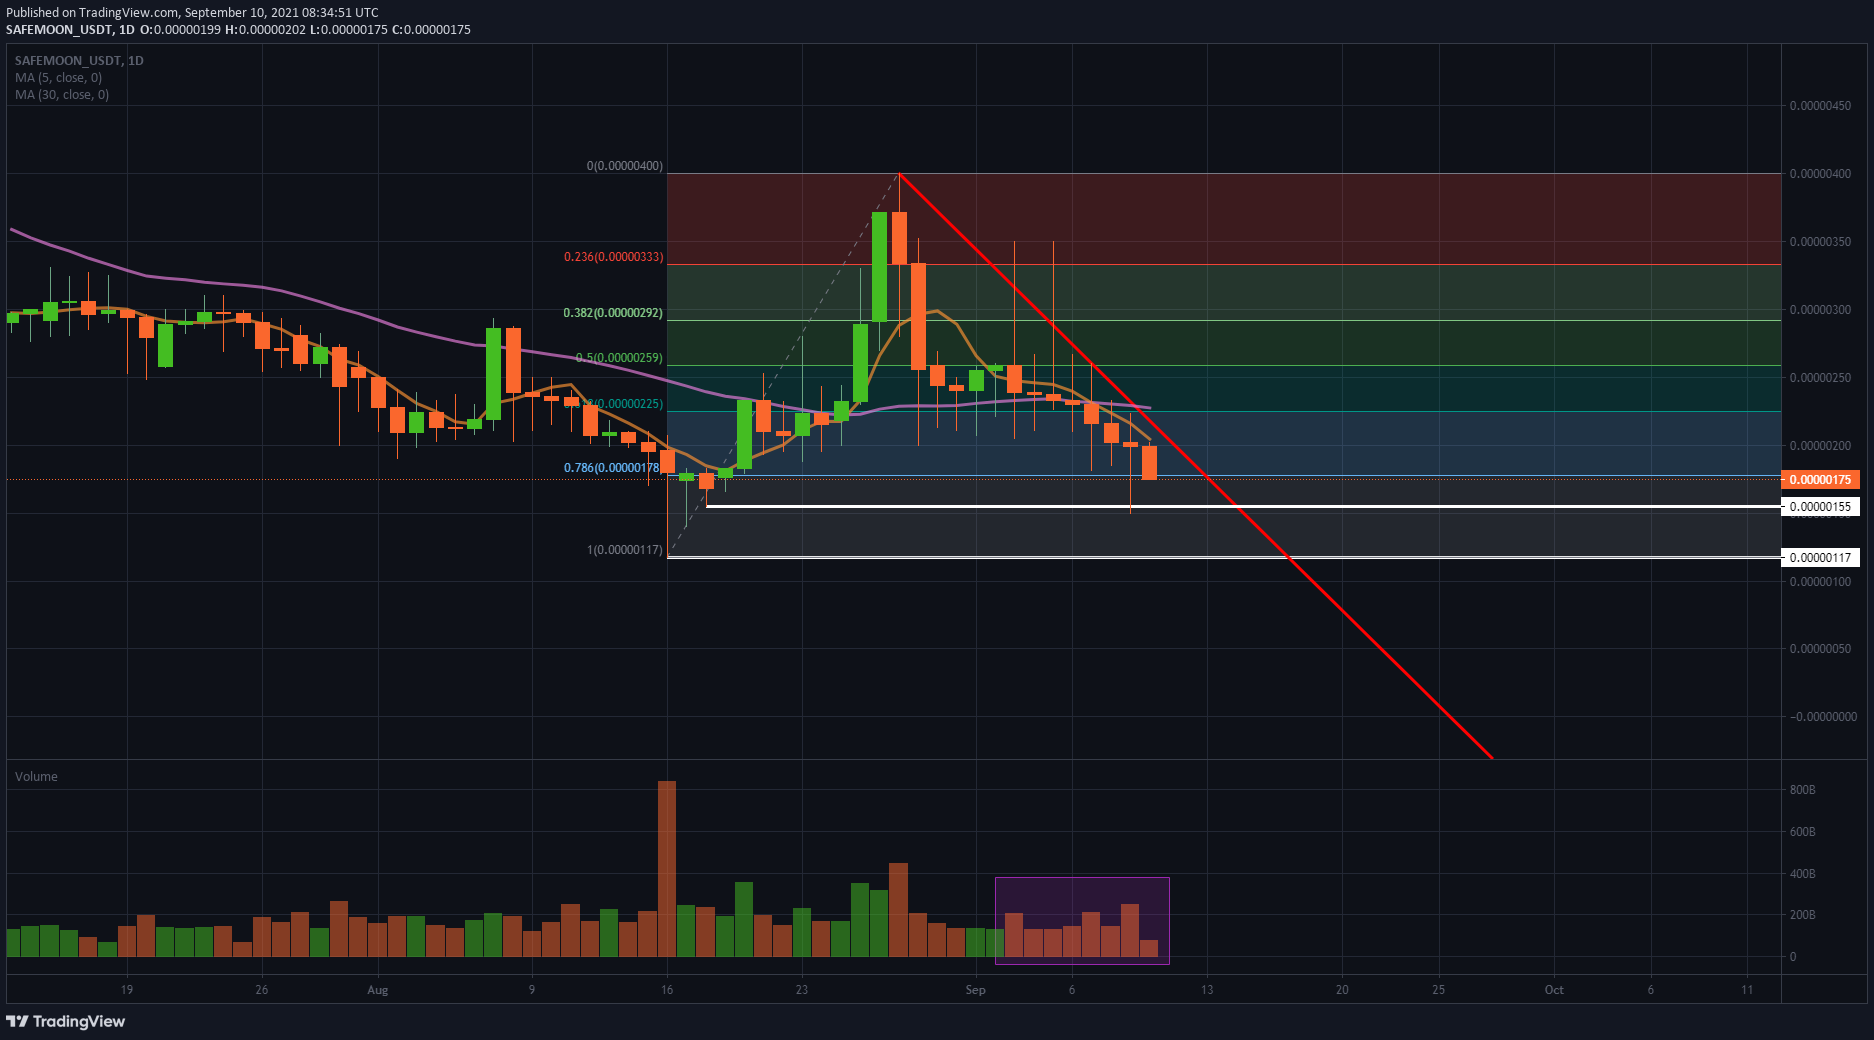
SafeMoon/USD daily chart
No real reason for buyers to step in at this point, as sellers have gained complete control of the price action. An intermediary level at $0.00000155 could do the trick temporarily and see some profit-taking from sellers to cash in on their profits. But again, that level looks weak with a short break below it yesterday.
It looks like sellers will try to go for the holy grail and book their last profits after this Fibonacci cycle at $0.00000117. This is where buyers as well will kindly step in to take over again. They will face many headwinds to the upside with the previously mentioned elements like the 5-day SMA and the red descending trend line as hurdles to overcome.
Information on these pages contains forward-looking statements that involve risks and uncertainties. Markets and instruments profiled on this page are for informational purposes only and should not in any way come across as a recommendation to buy or sell in these assets. You should do your own thorough research before making any investment decisions. FXStreet does not in any way guarantee that this information is free from mistakes, errors, or material misstatements. It also does not guarantee that this information is of a timely nature. Investing in Open Markets involves a great deal of risk, including the loss of all or a portion of your investment, as well as emotional distress. All risks, losses and costs associated with investing, including total loss of principal, are your responsibility. The views and opinions expressed in this article are those of the authors and do not necessarily reflect the official policy or position of FXStreet nor its advertisers. The author will not be held responsible for information that is found at the end of links posted on this page.
If not otherwise explicitly mentioned in the body of the article, at the time of writing, the author has no position in any stock mentioned in this article and no business relationship with any company mentioned. The author has not received compensation for writing this article, other than from FXStreet.
FXStreet and the author do not provide personalized recommendations. The author makes no representations as to the accuracy, completeness, or suitability of this information. FXStreet and the author will not be liable for any errors, omissions or any losses, injuries or damages arising from this information and its display or use. Errors and omissions excepted.
The author and FXStreet are not registered investment advisors and nothing in this article is intended to be investment advice.
Recommended Content
Editors’ Picks

Tether mints another $1,000,000,000 USDT on Justin Sun’s Tron blockchain: TRX traders could profit
Tether, the world’s largest stablecoin issuer, has minted another $1 billion worth of USDT on the Tron blockchain according to Whale Alert data published Friday.

XRP Price Prediction: XRP back above $2 liquidating $18M in short positions, will the rally continue?
Ripple (XRP) seeks support above $2.0020 on Thursday after gaining 14% in the past 24 hours. The token trades at $2.0007 at the time of writing, reflecting growing bullish sentiment across global markets.

Avalanche Octane update goes live on mainnet, slashes transaction fees significantly
Avalanche (AVAX) Octane update, live on mainnet on Thursday, introduces a dynamic fee mechanism to the C-Chain. This mechanism reduces transaction costs during high network activity by adjusting real-time fees, as per ACP-176.

Dogecoin soars as 21Shares files S-1 for DOGE ETF
Dogecoin (DOGE) rallied nearly 12% on Wednesday after asset manager 21Shares filed an S-1 application with the Securities & Exchange Commission (SEC) to launch the 21Shares Dogecoin exchange-traded fund (ETF).

Bitcoin Weekly Forecast: Tariff ‘Liberation Day’ sparks liquidation in crypto market
Bitcoin (BTC) price remains under selling pressure and trades near $84,000 when writing on Friday after a rejection from a key resistance level earlier this week.

The Best brokers to trade EUR/USD
SPONSORED Discover the top brokers for trading EUR/USD in 2025. Our list features brokers with competitive spreads, fast execution, and powerful platforms. Whether you're a beginner or an expert, find the right partner to navigate the dynamic Forex market.