- SafeMoon price gained as much as 400% in October and closed with a gain of 309%.
- SafeMoon is now 30% below the most recent all-time high.
- Strong support suggests downside risks are limited.
SafeMoon price, along with Shiba Inu, was one of the biggest surprises of October. However, threats of a deeper pullback could be dismissed given the deep retracement that occurred over the weekend, followed by solid dip-buying.
SafeMoon finds buyers at critical Ichimoku support levels, but a deeper retracement could occur
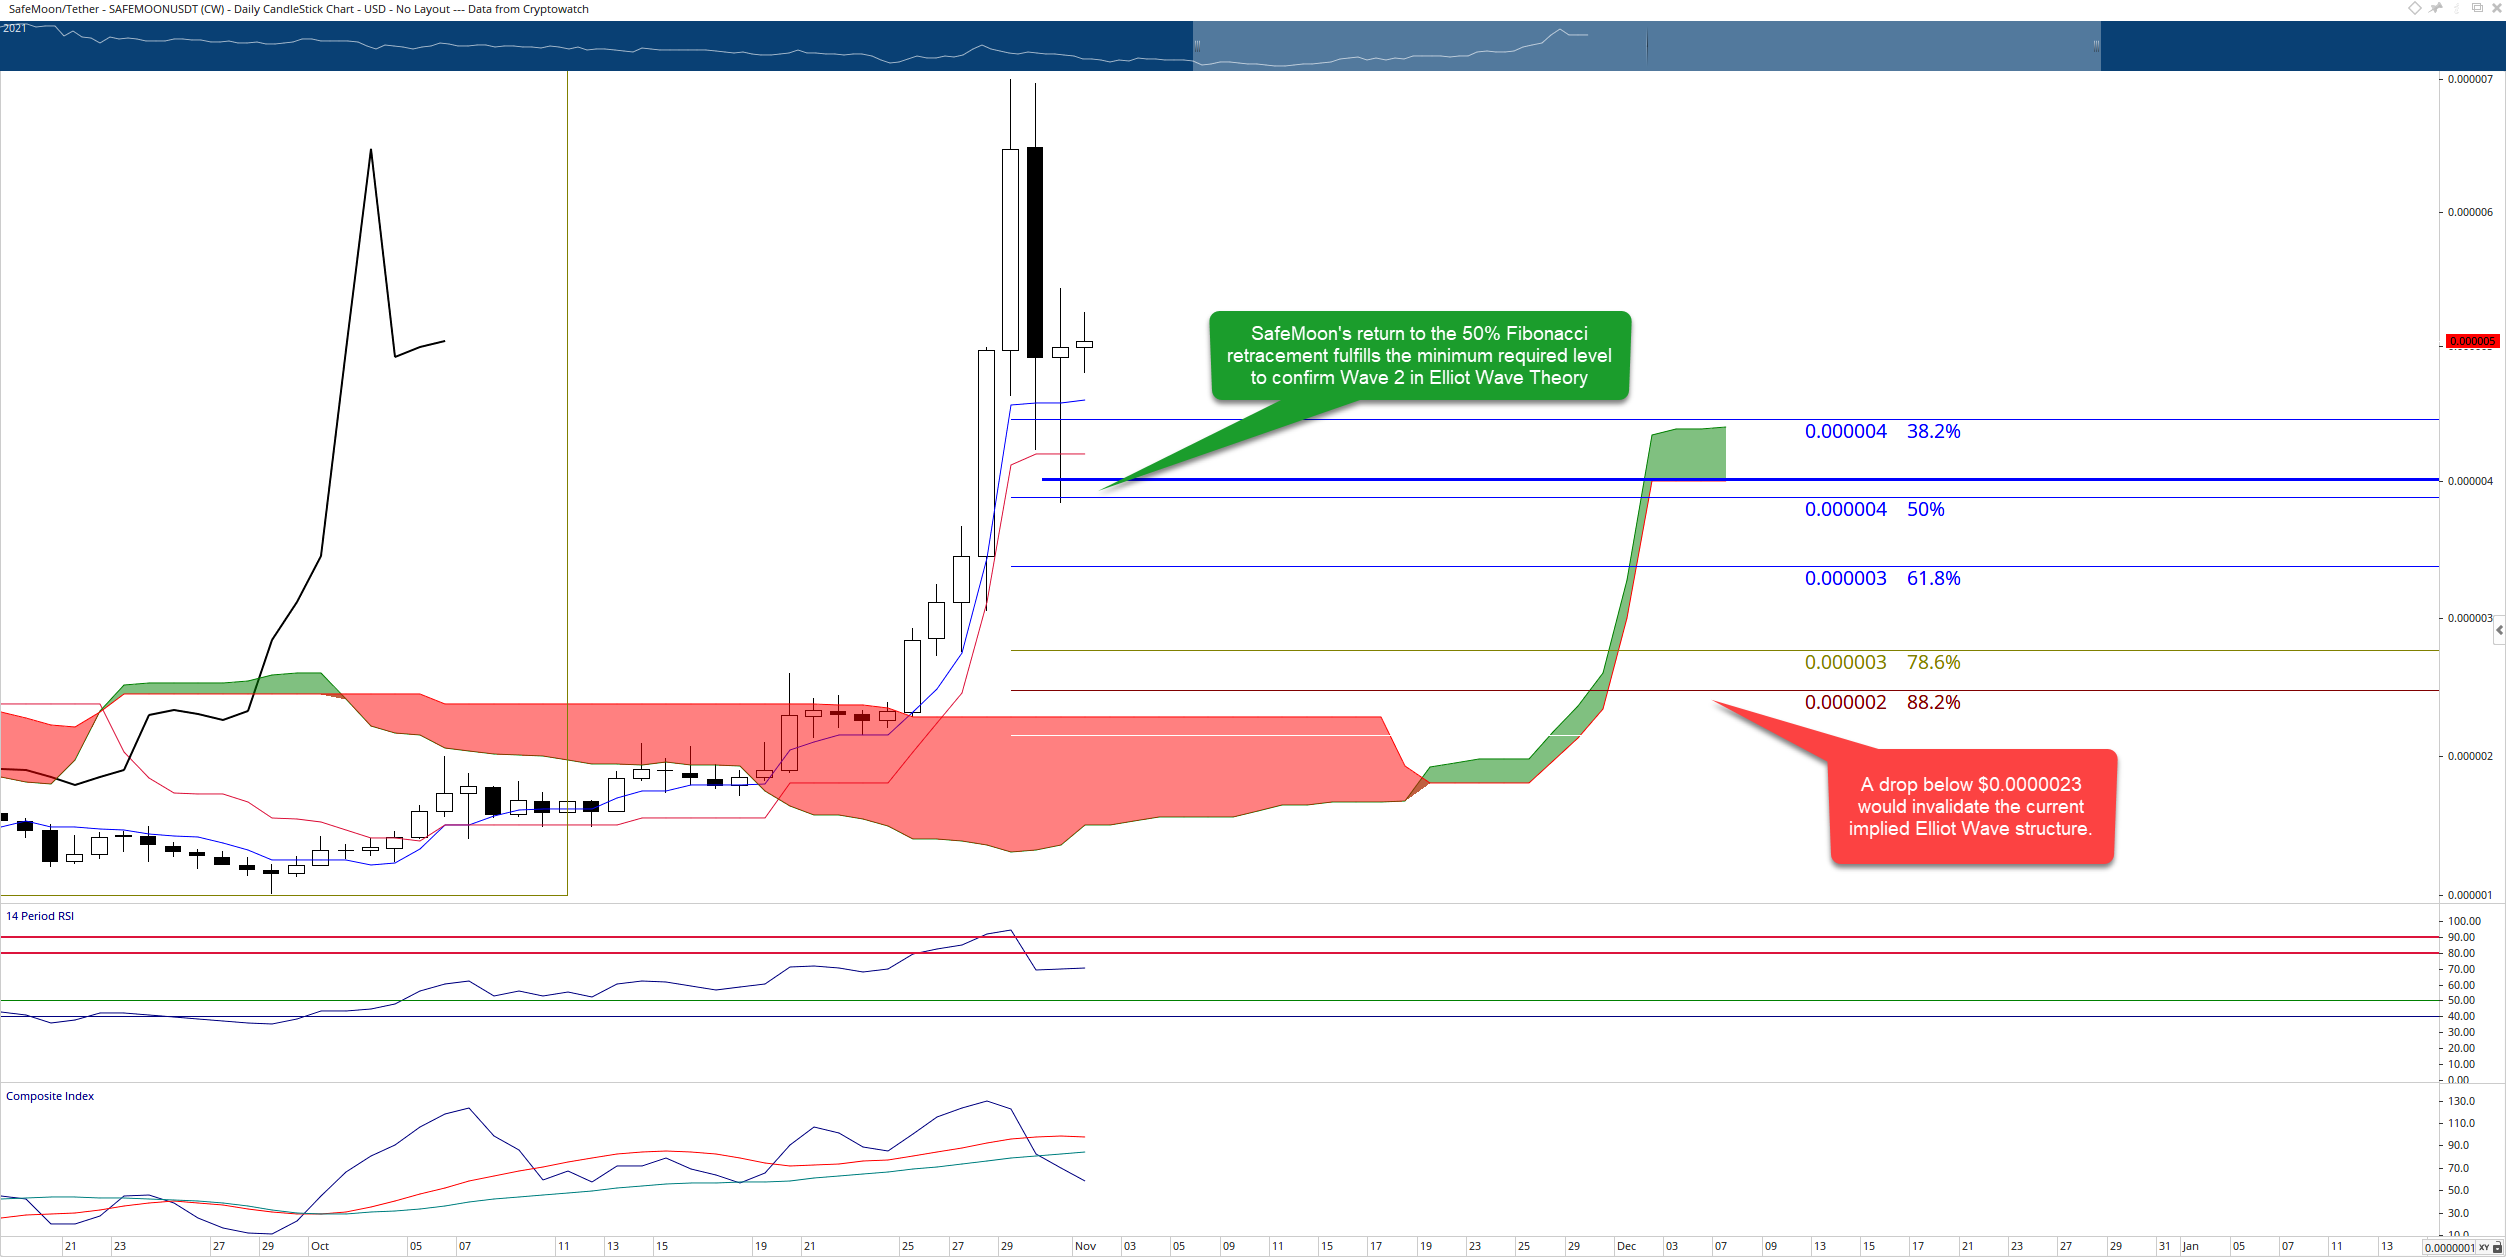
SafeMoon price has found buyers step at three key Ichimoku levels – the Tenkan-Sen, the Kijun-Sen and the weekly Tenkan-Sen (represented by a dark blue line/ray). Those three Ichimoku levels fall into a price range that from $0.0000040 to $0.0000047. Sellers tested those levels heavily during the Saturday and Sunday trading sessions.
Elliot Wave Theory can provide some ideas of how far SafeMoon price could pull back. Assuming that the massive bull run in October was Wave 1 of an Impulse Wave, that provides several price zones to consider. Wave 2 is often a 50%, 61.8%, 78.6% or 88.2% Fibonacci retracement of Wave 1. Using the bottom of the weekly strong bar as the retracement low, that gives traders the following price levels to consider:
50% - $0.0000039
61.8% - $0.0000033
78.6% - $0.0000029
88.2% - $0.0000023
SafeMoon price has already tested and found support against the 50% level at $0.0000039, but it remains to be seen whether SafeMoon will move lower. If it does not and the 50% level is where Wave 2 ends, then the next level to watch is the 161.8% Fibonacci expansion of Wave 1 at $0.000012, which would fulfill Wave 3 in the current, implied Impulse Wave. However, to move to that new all-time high, buyers will first need to return to the all-time high at $0.000007.
SAFEMOON/USDT Daily Ichimoku Chart
A return to $0.000007 would be invalidated if SafeMoon price moved below the 88.2% Fibonacci retracement at $0.0000023.
Note: All information on this page is subject to change. The use of this website constitutes acceptance of our user agreement. Please read our privacy policy and legal disclaimer. Opinions expressed at FXstreet.com are those of the individual authors and do not necessarily represent the opinion of FXstreet.com or its management. Risk Disclosure: Trading foreign exchange on margin carries a high level of risk, and may not be suitable for all investors. The high degree of leverage can work against you as well as for you. Before deciding to invest in foreign exchange you should carefully consider your investment objectives, level of experience, and risk appetite. The possibility exists that you could sustain a loss of some or all of your initial investment and therefore you should not invest money that you cannot afford to lose. You should be aware of all the risks associated with foreign exchange trading, and seek advice from an independent financial advisor if you have any doubts.
Recommended Content
Editors’ Picks

XRP chart signals 27% jump after SEC-Ripple appeals pause and $50 million settlement
Ripple (XRP) stabilized above $2.00 exemplifying a similar pattern to the largest cryptocurrency by market capitalization, Bitcoin (BTC), which holds firmly above $84,000 at the time of writing on Thursday.

Bitwise lists four crypto ETPs on London Stock Exchange
Bitwise announced on Wednesday that it had listed four of its Germany-issued crypto Exchange-Traded products (ETPs) on the London Stock Exchange. It aims to expand access to its products for Bitcoin (BTC) and Ethereum (ETH) investors and widen its footprint across European markets.

RAY sees double-digit gains as Raydium unveils new Pumpfun competitor
RAY surged 10% on Wednesday as Raydium revealed its new meme coin launchpad, LaunchLab, a potential competitor to Pump.fun — which also recently unveiled its decentralized exchange (DEX) PumpSwap.

Ethereum Price Forecast: ETH face value- accrual risks due to data availability roadmap
Ethereum (ETH) declined 1%, trading just below $1,600 in the early Asian session on Thursday, as Binance Research's latest report suggests that the data availability roadmap has been hampering its value accrual.

Bitcoin Weekly Forecast: Market uncertainty lingers, Trump’s 90-day tariff pause sparks modest recovery
Bitcoin (BTC) price extends recovery to around $82,500 on Friday after dumping to a new year-to-date low of $74,508 to start the week. Market uncertainty remains high, leading to a massive shakeout, with total liquidations hitting $2.18 billion across crypto markets.

The Best brokers to trade EUR/USD
SPONSORED Discover the top brokers for trading EUR/USD in 2025. Our list features brokers with competitive spreads, fast execution, and powerful platforms. Whether you're a beginner or an expert, find the right partner to navigate the dynamic Forex market.
