SafeMoon Price Prediction: SAFEMOON is dead money below $0.00000287
- SafeMoon price resumes a downward trajectory with the 20-day simple moving average (SMA) providing resistance.
- SAFEMOON spike of 30.59% on August 7 was a technical event, not the beginning of a new uptrend.
- A social volume metric shows no sustainable interest in the altcoin since June 1.

SafeMoon price has failed to sustain the largest one-day gain since the May 6 rally of 59.79%, while dropping back near the August 2 low of $0.00000190. The technical event did nothing to alter the bearish tone established by the breakdown from a descending triangle on July 28. As a result, SAFEMOON remains on pace to test the triangle's measured move price target of $0.00000111.
SafeMoon price shows no upside potential
From the May 19 collapse until July 27, SafeMoon price constructed a descending triangle pattern that resolved to the downside on July 28. SAFEMOON immediately fell over 25%, leading to an oversold condition on the daily Relative Strength Index (RSI) on August 2. The altcoin moved sideways and closed on August 7 with a 30.59% gain.
The burst higher did carry SafeMoon price above the descending triangle support line and the commanding 20-day SMA. However, the gains were quickly erased on August 8, confirming that the impressive one-day rally was not the beginning of a new SAFEMOON uptrend but a technical reaction to the oversold condition on the daily RSI.
The SAFEMOON reversal has continued, pressing SafeMoon price down to $0.00000199 today, just above the August 2 low of $0.00000190.
The measured move of the descending triangle pattern is around 57%, defining $0.00000111 as the SafeMoon price target. SAFEMOON will need to fall an additional 47% from the current price to reach the measured move target. A realistic scenario based on the bearish price structure and absence of bullish sentiment in the retail investor ranks.
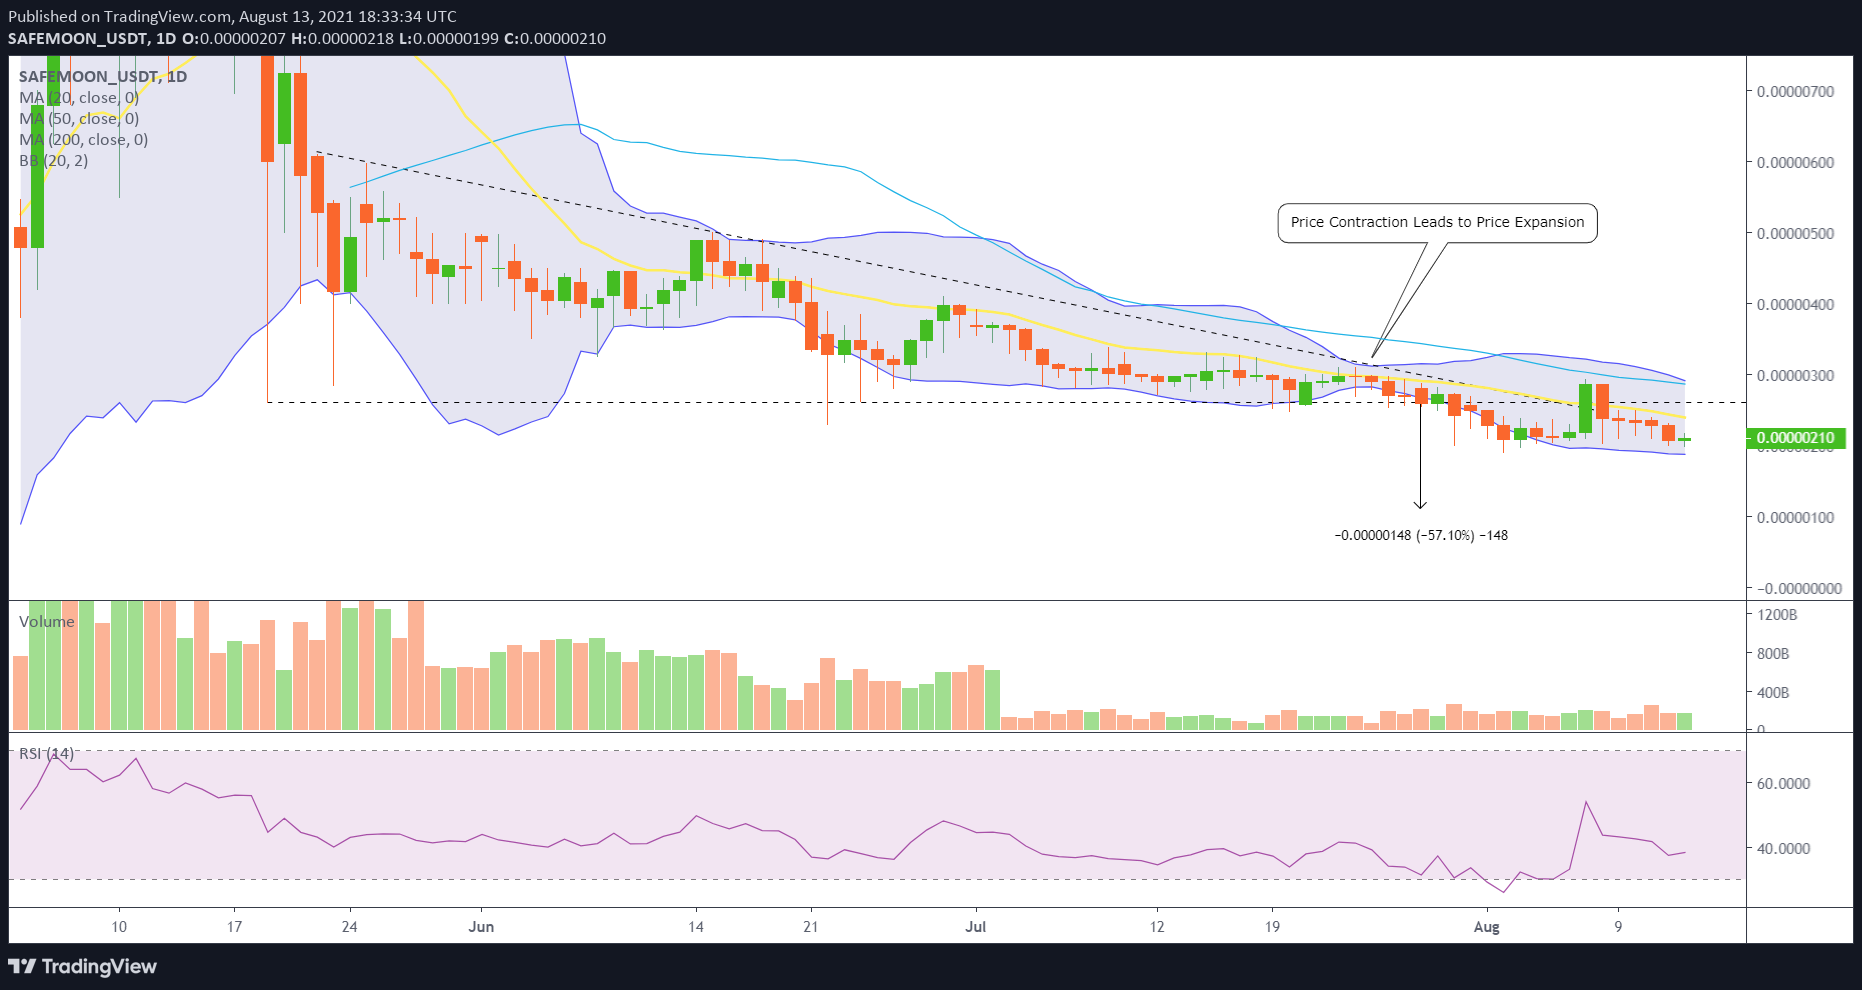
SAFEMOON/USD daily chart
To begin a break from the SAFEMOON price structure and a reassessment of the bearish narrative, SafeMoon price needs to log a daily close above the 50-day SMA, which resides at $0.00000287. Otherwise, speculators will be caught in the fluid support and resistance attributed to the 20-day SMA at $0.00000240, the May 19 low of $0.00000261 and the 50-day SMA.
The failure of SafeMoon price to capitalize on the 30.59% spike reflects the disinterest in SAFEMOON among retail investors. The Santiment Social Volume indicator, which shows the number of mentions of the coin on 1000+ crypto social media channels, reveals that social media traffic has held constant with the occasional spike higher since June 1. None of the jumps in traffic have proved sustainable.
SAFEMOON, a cryptocurrency with no real-world use, needs the power of social media to sustain higher prices, or it is doomed to trend lower until a concrete use emerges for the token that can positively dictate SafeMoon price action.
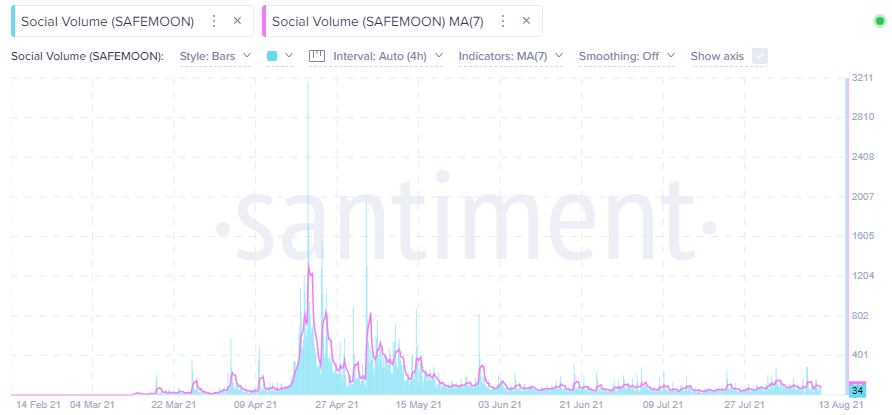
SAFEMOON Social Volume - Santiment
From a technical or fundamental perspective, there is no redeeming value in SAFEMOON or reasons for SafeMoon to target higher prices. If a broad, impulsive rally in the cryptocurrency complex cannot motivate better SAFEMOON outcomes, investors should prepare for the weakness to continue and reach at least the measured move target of $0.00000111. So yeah, fear the reaper.
Author

Sheldon McIntyre, CMT
Independent Analyst
Sheldon has 24 years of investment experience holding various positions in companies based in the United States and Chile. His core competencies include BRIC and G-10 equity markets, swing and position trading and technical analysis.


