SafeMoon bulls lack conviction, directional bias disappears
- SafeMoon price is trading close to the lower range at $0.00000257 since June 22.
- Although a clear directional bias is absent, if the bulls shatter $0.00000338, a bullish trend will be established.
- On the other hand, a breakdown of the support level at $0.00000257 could trigger a 23% downswing to $0.00000198.

SafeMoon price seems to have lost its charm after setting up a swing low on June 22. Since this point, SAFEMOON has continued to trade close to the lower range. A breakdown of this barrier might confirm the start of a downtrend.
SafeMoon price lacks clear bias
SafeMoon price has been consolidating near the range low at $0.00000257 for roughly three weeks. The support level at $0.00000271 is being tested for the third time over the past eight days. While a breakdown of this level is possible, investors should not disregard a potential surge in buying pressure that kick-starts an uptrend.
Despite having no clear directional bias, market participants can expect a sweep of the range low at $0.00000257 followed by a 30% ascent that slices through $0.00000273 and $0.00000295 resistance ceilings and tags $0.00000338.
A decisive 4-hour candlestick close above this barrier will set up a higher high and confirm the start of a new rally. In that case, SAFEMOON could extend another 25% to tag $0.00000374.
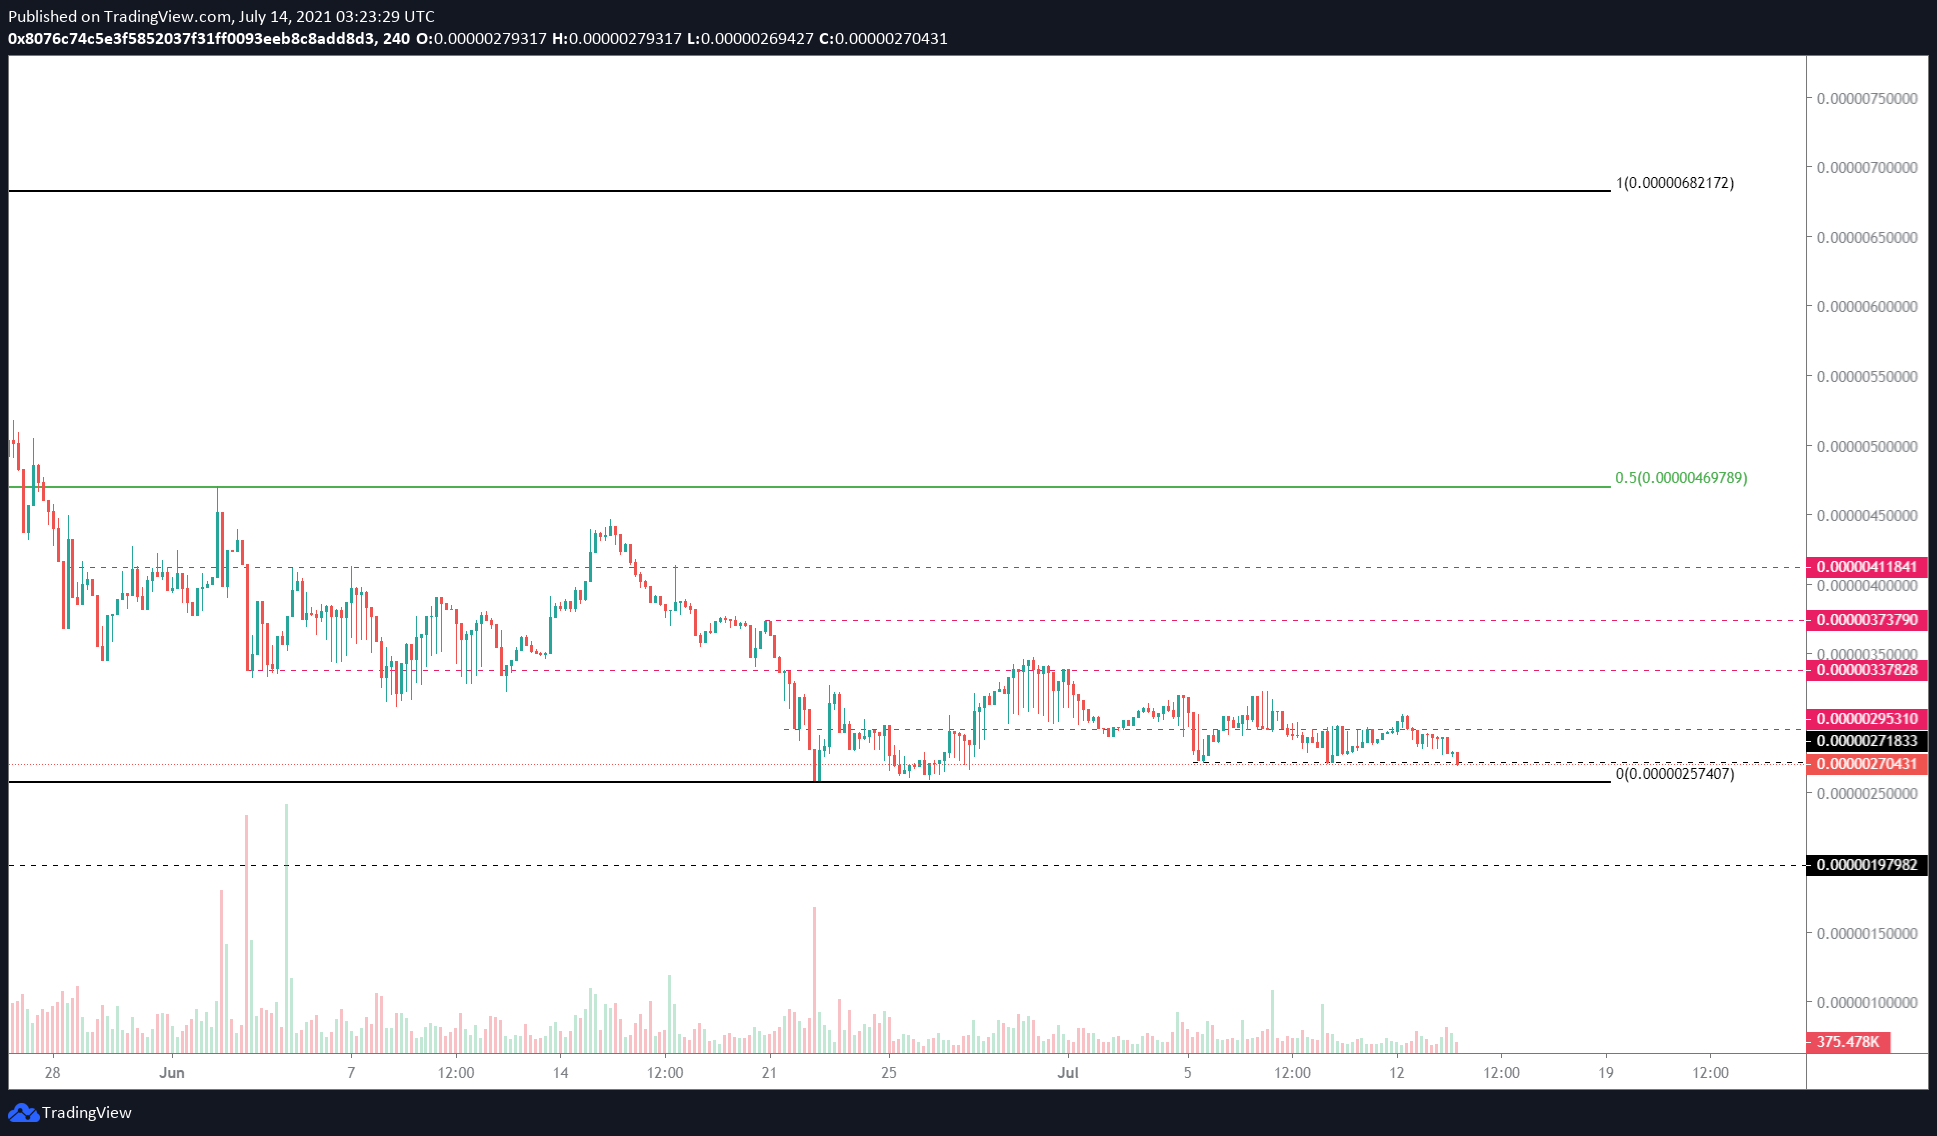
SAFEMOON/USDT 4-hour chart
While the upswing narrative detailed above seems plausible, investors need to note that a breakdown of the range low will invalidate it. A decisive 4-hour candlestick close below $0.00000257 will indicate increased selling pressure.
The inability of the buyers to reclaim the said barrier could trigger a 23% downswing to the $0.00000198 support level.
Author

Akash Girimath
FXStreet
Akash Girimath is a Mechanical Engineer interested in the chaos of the financial markets. Trying to make sense of this convoluted yet fascinating space, he switched his engineering job to become a crypto reporter and analyst.


