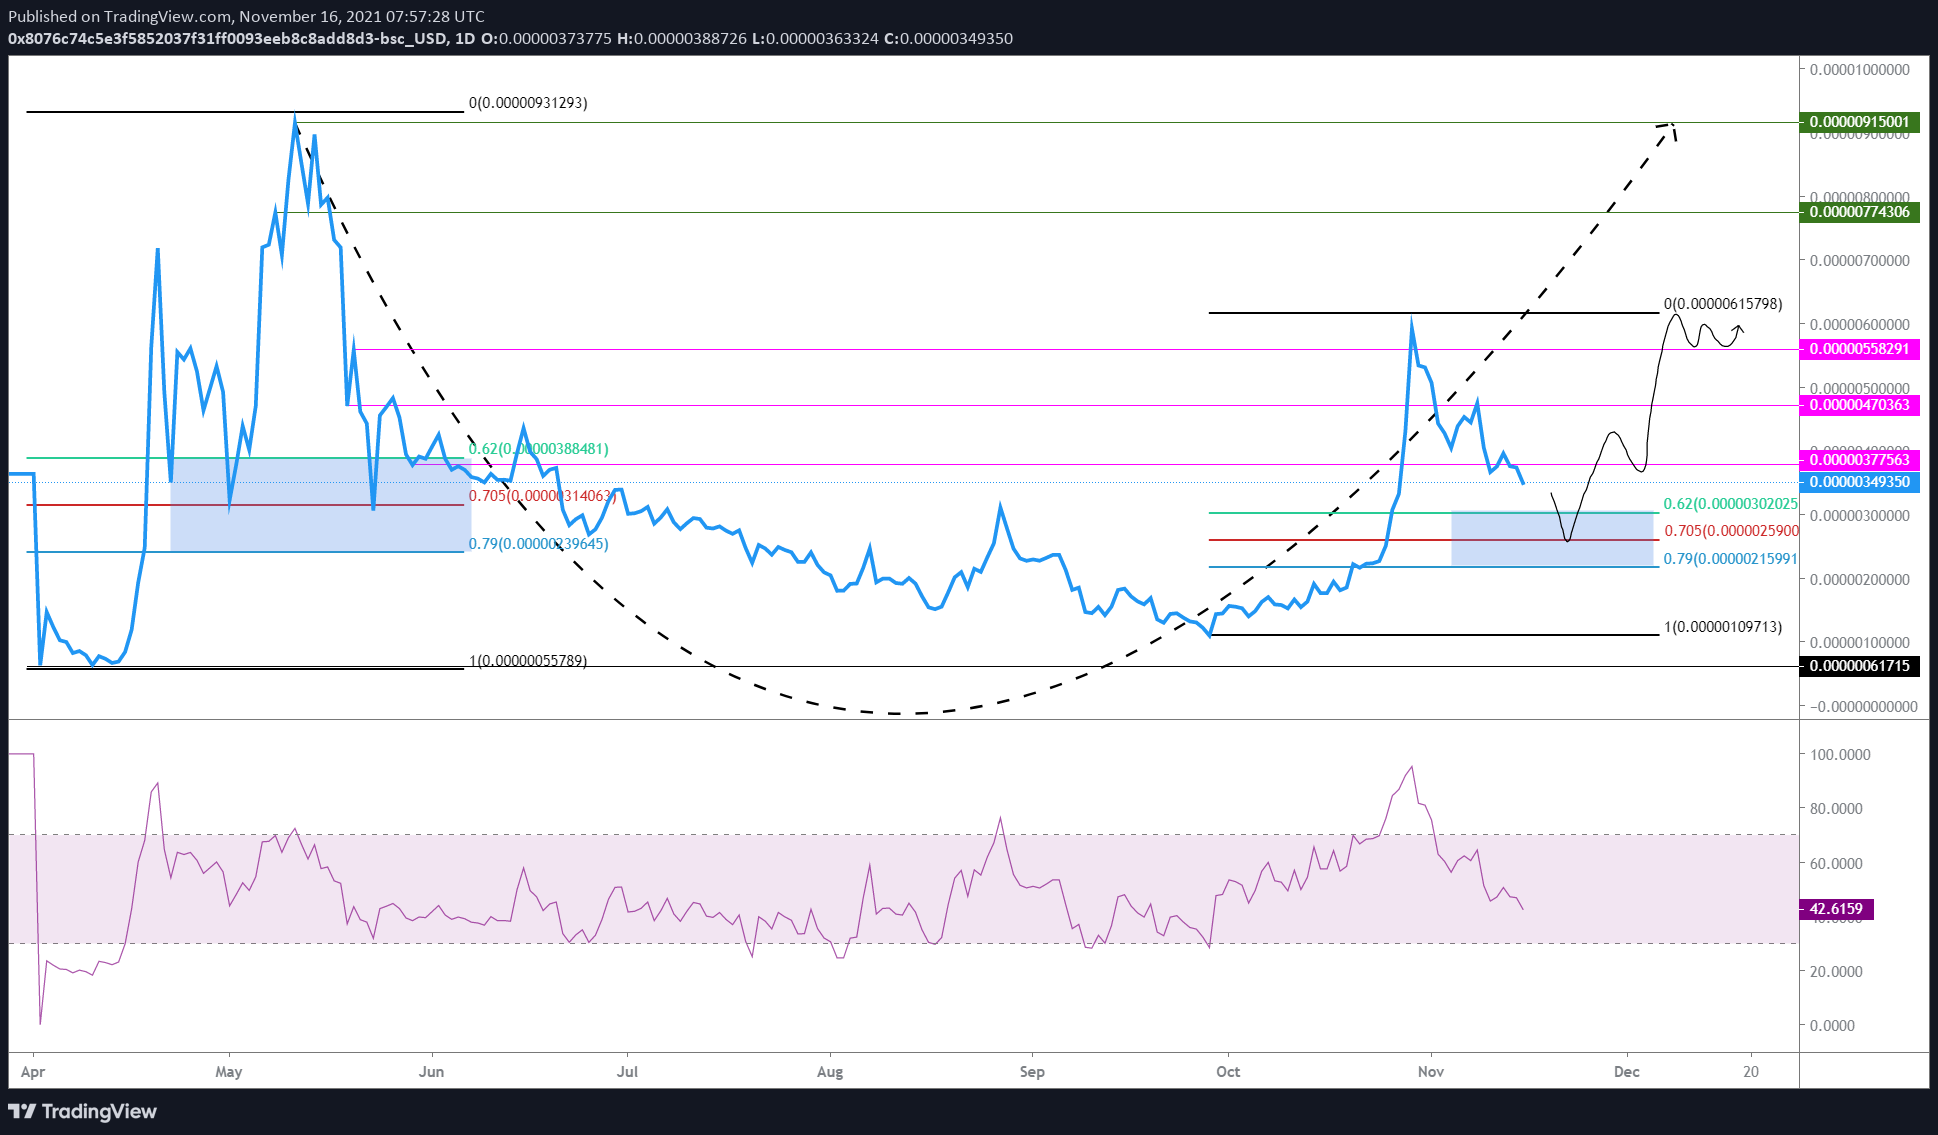
• SafeMoon price will likely continue its 46% descent as it approaches a crucial support floor.
  • A dip into the high probability reversal zone, extending from $0.00000215 to $0.00000302 could trigger a massive explosive uptrend.
  • A breakdown of the $0.00000109 support level will invalidate the bullish thesis for SAFEMOON.

SafeMoon price is taking a break from its steady uptrend as it retraces, breaking crucial support barriers. That said, it is not beyond revival. In fact, SAFEMOON is approaching a high probability reversal zone that is likely to end the downtrend and kick-start a new rally.

SafeMoon price to catapult higher

SafeMoon price has dropped roughly 47% since October 29 to where it currently trades at $0.00000349. The downswing comes after SAFEMOON rallied by a whopping 461% between September 28 and October 29.

The altcoin suffered a fatal downswing after its all-time high in May, but the recent run-up is just the beginning. As mentioned in previous articles, SafeMoon price is coming full circle and aims to retest the $0.00000915 resistance barrier. 

So far, it has only tagged the midpoint of this range and is currently undergoing a brief correction. However, investors can expect SafeMoon price to continue its uptrend due to two reasons:

  • SAFEMOON is approaching a high probability reversal zone.
  • The Relative Strength Index (RSI) is close to hitting the oversold zone.

The high probability reversal zone extends from $0.00000215 to $0.00000302. A dip into this area will put SAFEMOON price at a great discount and trigger a buying frenzy among sidelined investors. Consequently, catalyzing an up move that shatters the $0.00000377, $0.00000470 and $0.00000558 resistance barriers before it makes a run at the October 29 swing high at $0.00000615.

Similar price action occurred in May when SafeMoon price dived into a high probability reversal zone, extending from $0.00000239 to $0.00000388. The downswing was succeeded by a sudden spike in buying pressure that propelled the altcoin by 62%.

While the initial reason has to do more with the SafeMoon price action, the second reason is a result of the recent downswing. 

The 47% price decline seen since October 29 caused the RSI to dip from largely overbought at 94 to where it currently hovers at 42. Still, the RSI seems to have more room to go down until it hits oversold territory, which suggests SafeMoon price can also continue to decline. 

Using the RSI as a standalone indicator can be inaccurate but coupled with the high probability reversal zone, it indicates that SafeMoon price is in for a treat.

As for the upside targets, $0.00000615 is an initial target for SafeMoon price, but the altcoin is likely to breach through this zone and reach for the crucial $0.00000774 or $0.00000915 barriers. This move would constitute 200% and 250% run-ups from the 70.5% Fibonacci retracement level at $0.00000259.

SAFEMOON/USDT 1-day chart

SAFEMOON/USDT 1-day chart

On the other hand, if Safemoon price fails to bounce off the high probability reversal zone, ranging from $0.00000215 to $0.00000302, it will signal a dearth of buying pressure. In such a case, SAFEMOOON price will revisit the range low at $0.00000109. A swing low below this level will invalidate the bullish thesis and propel SAFEMOON to all-time lows.


Information on these pages contains forward-looking statements that involve risks and uncertainties. Markets and instruments profiled on this page are for informational purposes only and should not in any way come across as a recommendation to buy or sell in these assets. You should do your own thorough research before making any investment decisions. FXStreet does not in any way guarantee that this information is free from mistakes, errors, or material misstatements. It also does not guarantee that this information is of a timely nature. Investing in Open Markets involves a great deal of risk, including the loss of all or a portion of your investment, as well as emotional distress. All risks, losses and costs associated with investing, including total loss of principal, are your responsibility. The views and opinions expressed in this article are those of the authors and do not necessarily reflect the official policy or position of FXStreet nor its advertisers. The author will not be held responsible for information that is found at the end of links posted on this page.

If not otherwise explicitly mentioned in the body of the article, at the time of writing, the author has no position in any stock mentioned in this article and no business relationship with any company mentioned. The author has not received compensation for writing this article, other than from FXStreet.

FXStreet and the author do not provide personalized recommendations. The author makes no representations as to the accuracy, completeness, or suitability of this information. FXStreet and the author will not be liable for any errors, omissions or any losses, injuries or damages arising from this information and its display or use. Errors and omissions excepted.

The author and FXStreet are not registered investment advisors and nothing in this article is intended to be investment advice.

Join Telegram

Recommended content


Recommended Content

Editors’ Picks

Celebrity meme coins controversy continues amid Pump.fun revenue dominance

Celebrity meme coins controversy continues amid Pump.fun revenue dominance

Pump.fun outperformed the Ethereum blockchain on Tuesday after raking in $1.99 million. Following this achievement, a meme coin based on actress Sydney Sweeney was the subject of controversy after its developers dumped their bags on investors.

More Meme Coins News

PEPE's on-chain metrics indicate potential rally after weeks of silence

PEPE's on-chain metrics indicate potential rally after weeks of silence

PEPE has struggled to see any significant price move after reaching an all-time high in May. Increased adoption rate and low MVRV ratio indicate a bullish run may be on the horizon. A single PEPE outflow from Binance worth $14.7 million gives credence to signs of bullish expectation.

More Pepe News

Ethereum has failed to overcome key resistance despite bullish sentiment surrounding ETH ETF

Ethereum has failed to overcome key resistance despite bullish sentiment surrounding ETH ETF

Ethereum (ETH) is down more than 1.4% on Tuesday following another ETH sale from the Ethereum Foundation. Meanwhile, crypto exchange Gemini's recent report reveals that ETH ETF could see about $5 billion in net inflows within six months of launch.

More Ethereum News

Crypto community blasts Polkadot following report of treasury spending

Crypto community blasts Polkadot following report of treasury spending

Polkadot reports $87 million of treasury spending during H1. Crypto community members expressed harsh feelings toward the DOT team's high spending. DOT is up more than 2% in the past 24 hours but risks correction following the report.

More Polkadot News

Bitcoin: BTC price correction could end in July, according to seasonal data

Bitcoin: BTC price correction could end in July, according to seasonal data

Bitcoin (BTC) price appears poised for a decline this week, influenced by slight outflows in US spot ETFs, selling activity among BTC miners, and a combined transfer of 4,690.28 BTC to centralized exchanges by the US and German governments.

Read full analysis

BTC

ETH

XRP