SafeMoon price is getting squeezed as bears take control
- SafeMoon price sellers took control in the last week of August and have been defending the descent since.
- On the downside, SafeMoon price action is treading water, and $0.00000150 is under pressure.
- A break lower could spell more the comeback of negative prices.

SafeMoon (SAFEMOON) is under siege by the bears. For the fourth consecutive week in a row, price action is getting lower highs. Sellers seem to be in control with respect to the red descending trend line. Buyers are standing on the sideline and are waiting for a turn in momentum.
SafeMoon price could see further decimation in the coming month
SafeMoon buyers still in the price action did not have much fun thus far on their positions. Since the last week of August, the highs have been trading down. Lower highs are the signature reflection of the bears being in control. Not only are sellers defending the red descending trend line. But to make matters worse, the 10-day Simple Moving Average (SMA) has been broken to the downside and is now putting a cap on the further upside in SAFEMOON.
On the downside, price action is getting squeezed against $0.00000150. Although price action went even lower in previous weeks, the body of the candles has been holding above $0.00000150 for now. So the dips below that level are being bought for now. But as already pointed out, buyers see more and more dark clouds above possible returns. This is shown as well in the volume that has been continuously decreasing since July.
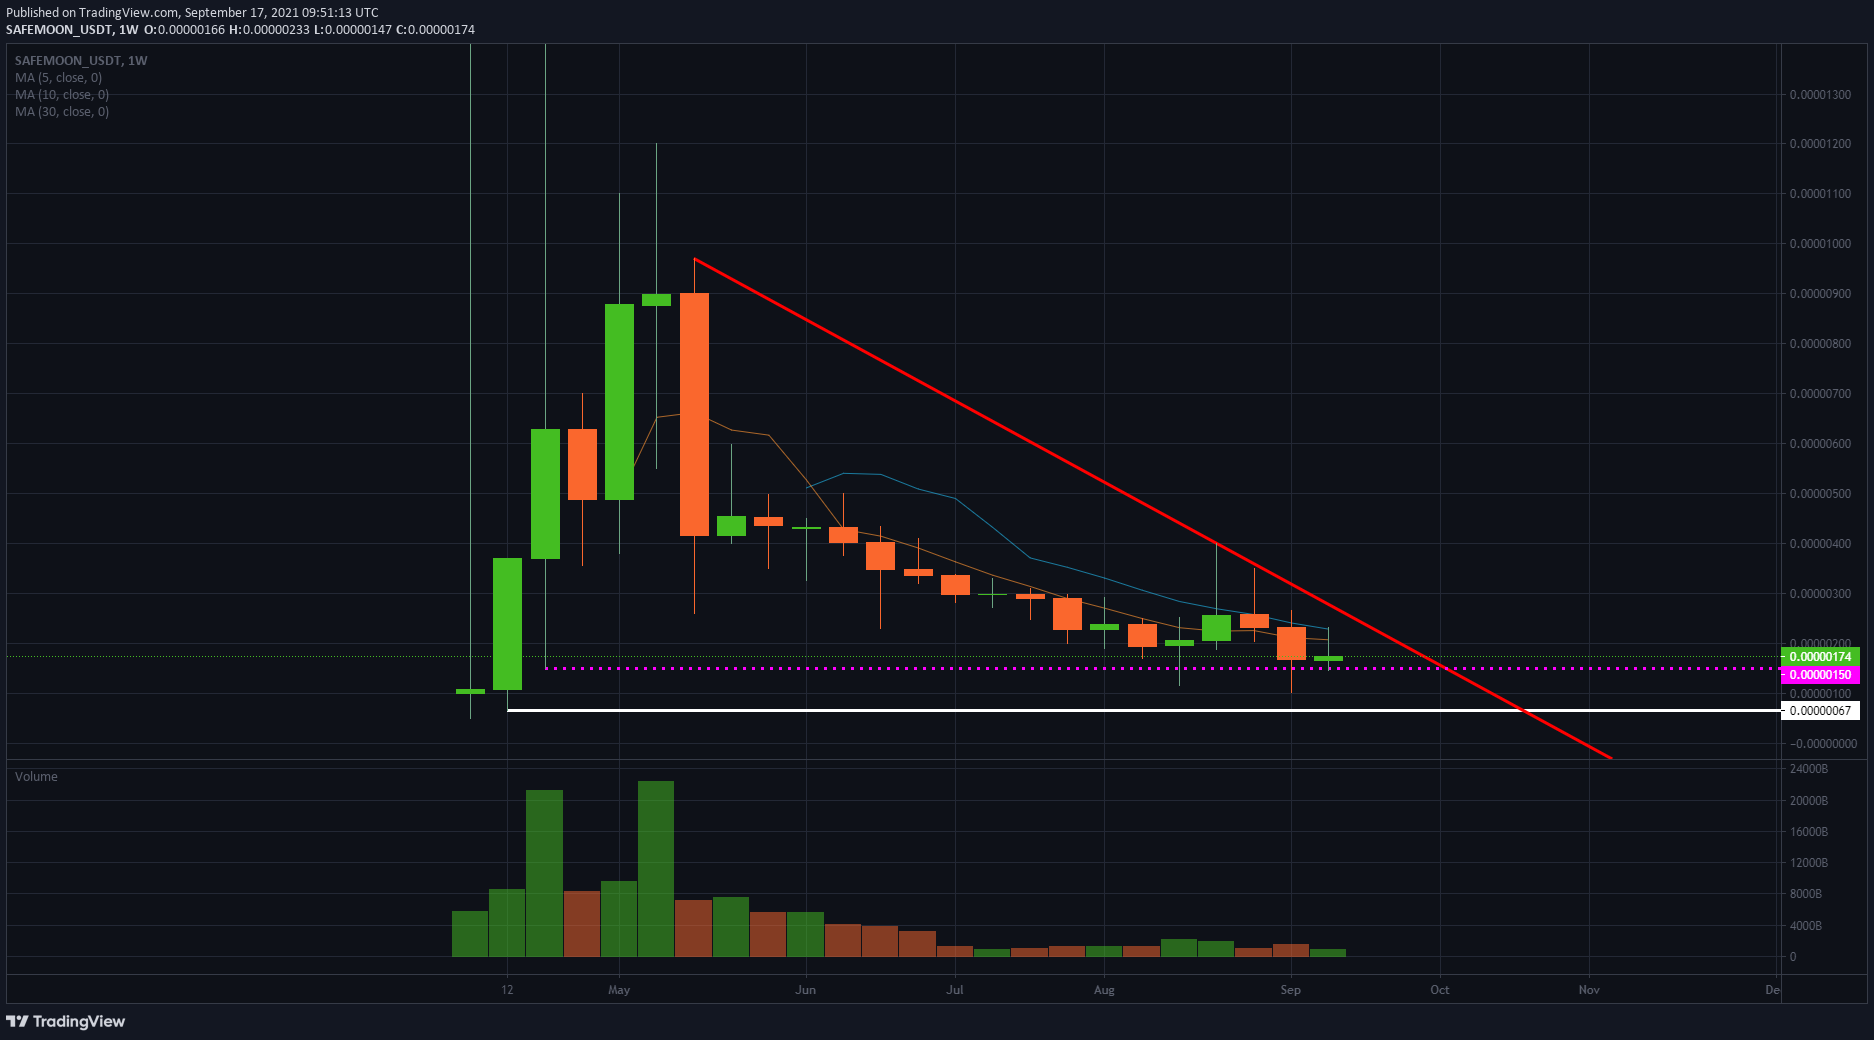
SAFEMOON/USD weekly chart
With the bears pushing price action to the downside, a test towards its all-time low could arise in SAFEMOON. A retest of the low in the second week of its existence looks plausible, near $0.00000067. With prices already very much decimated, buyers look to have put SAFEMOON aside for now.
A rather big paradox is that with price action going down, sellers will not find a party that is willing to sell around these prices. This way, sellers can not book any profit, and price action will inevitably ramp up again because of the skew in bid/ask. That move might come quite quickly and rapidly and push SAFEMOON to another retest of the red descending trend line.
Author

Filip Lagaart
FXStreet
Filip Lagaart is a former sales/trader with over 15 years of financial markets expertise under its belt.


