![]() Sheldon McIntyre, CMT
Sheldon McIntyre, CMT
Independent Analyst
- SafeMoon price continues to develop a descending triangle pattern with a measured move target of $0.00000133.
- Daily volume has slumped over the last ten days, suggesting indecision among SAFEMOON speculators.
- 10-day simple moving average (SMA) leaning on price, creating a very tight trading range over the last three days.
SafeMoon price action reflects the general lack of direction in the cryptocurrency complex, showing no commitment or energy. However, the descending triangle pattern proposes a clear roadmap for SAFEMOON, placing the risk to the downside and forecasting a potentially large loss if the bearish pattern resolves to the downside.
SafeMoon price drift creates havoc for the impatient investors
A descending triangle is classified as a bearish formation that usually emerges as a continuation pattern during a downtrend and indicates distribution. The horizontal trend line signifies demand that blocks the security from falling, while the lower reaction highs form the declining trend line as selling pressure increases.
Since May 21, SafeMoon price has shaped a descending triangle pattern with the horizontal trend line at $0.00000285 providing the trigger. On several occasions, SAFEMOON has glided below the horizontal trend line but has failed to register a daily close below, creating a challenge for eager bears.
If SafeMoon price records a daily close below $0.00000285, it will trigger the descending triangle pattern and officially shift the focus to the downside potential for SAFEMOON. The support levels that will intervene if selling pressure swells include the May 19 low of $0.00000261 and the June 22 low of $0.00000230, representing a 20% decline from the horizontal trend line.
Beyond the June 22 low, SafeMoon price is clear to plunge to the April 21 crash low of $0.00000150 before reaching the measured move target price of $0.00000133, representing a 50% decline from the horizontal trend line.
A collapse of 50% would wipe out most of the 2,140% gain accumulated during the explosive rally from April 15 to April 20 and secure an oversold reading on the SAFEMOON daily Relative Strength Index (RSI).
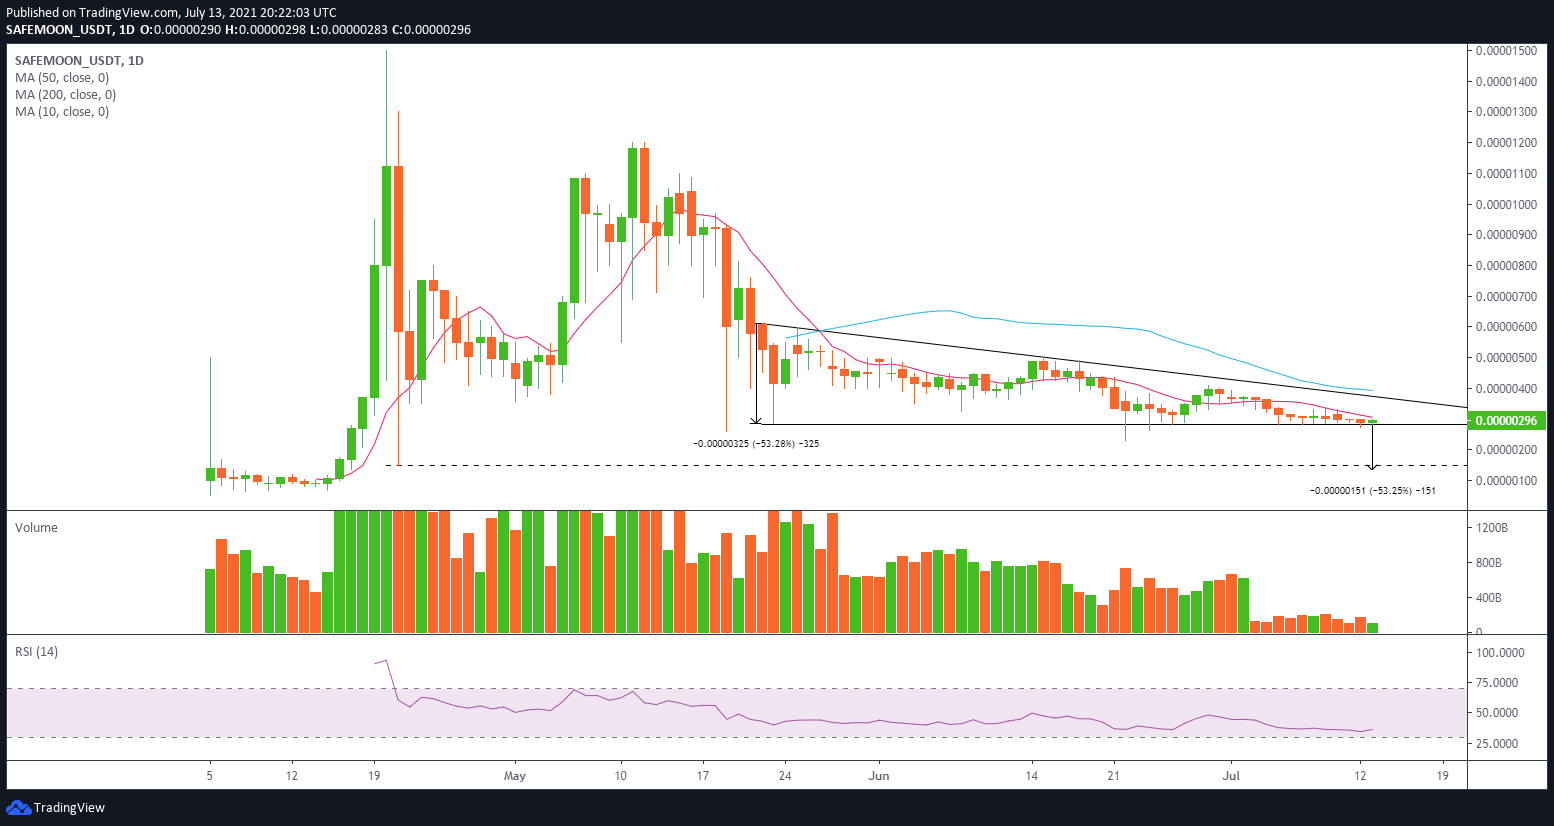
SAFEMOON/USD daily chart
Conversely, if SafeMoon price can complete a daily close above $0.00000338, it would alleviate the pressure generated by the declining 10-day SMA at $0.00000306 and free SAFEMOON to target the descending triangle’s upper trend line at $0.00000371, yielding a 30% gain from the current price.
With SafeMoon price currently trading at $0.00000287, SAFEMOON is hanging on the edge of a significant decline that will further dent the hopes of the novice cryptocurrency becoming a compelling investment alternative in the market. For now, investors need to be patient and let the pattern resolve, one way or the other.
Note: All information on this page is subject to change. The use of this website constitutes acceptance of our user agreement. Please read our privacy policy and legal disclaimer. Opinions expressed at FXstreet.com are those of the individual authors and do not necessarily represent the opinion of FXstreet.com or its management. Risk Disclosure: Trading foreign exchange on margin carries a high level of risk, and may not be suitable for all investors. The high degree of leverage can work against you as well as for you. Before deciding to invest in foreign exchange you should carefully consider your investment objectives, level of experience, and risk appetite. The possibility exists that you could sustain a loss of some or all of your initial investment and therefore you should not invest money that you cannot afford to lose. You should be aware of all the risks associated with foreign exchange trading, and seek advice from an independent financial advisor if you have any doubts.
Recommended Content
Editors’ Picks

Shiba Inu eyes positive returns in April as SHIB price inches towards $0.000015
Shiba Inu's on-chain metrics reveal robust adoption, as addresses with balances surge to 1.4 million. Shiba Inu's returns stand at a solid 14.4% so far in April, poised to snap a three-month bearish trend from earlier this year.

AI tokens TAO, FET, AI16Z surge despite NVIDIA excluding crypto-related projects from its Inception program
AI tokens, including Bittensor and Artificial Superintelligence Alliance, climbed this week, with ai16z still extending gains at the time of writing on Friday. The uptick in prices of AI tokens reflects a broader bullish sentiment across the cryptocurrency market.

Bitcoin Weekly Forecast: BTC consolidates after posting over 10% weekly surge
Bitcoin price is consolidating around $94,000 at the time of writing on Friday, holding onto the recent 10% increase seen earlier this week. This week’s rally was supported by strong institutional demand, as US spot ETFs recorded a total inflow of $2.68 billion until Thursday.

XRP price could renew 25% breakout bid on surging institutional and retail adoption
Ripple price consolidates, trading at $2.18 at the time of writing on Friday, following mid-week gains to $2.30. The rejection from this weekly high led to the price of XRP dropping to the previous day’s low at $2.11, followed by a minor reversal.
Bitcoin Weekly Forecast: BTC consolidates after posting over 10% weekly surge
Bitcoin (BTC) price is consolidating around $94,000 at the time of writing on Friday, holding onto the recent 10% increase seen earlier this week.

The Best brokers to trade EUR/USD
SPONSORED Discover the top brokers for trading EUR/USD in 2025. Our list features brokers with competitive spreads, fast execution, and powerful platforms. Whether you're a beginner or an expert, find the right partner to navigate the dynamic Forex market.