![]() Sheldon McIntyre, CMT
Sheldon McIntyre, CMT
Independent Analyst
- SafeMoon price is being influenced by the April trend line as it tries to resolve a descending triangle pattern.
- SAFEMOON 21-day simple moving average (SMA) exerting downward pressure on price over the last month.
- Daily volume continues to languish well below the 50-day SMA, reflecting a collapse in interest for the cryptocurrency.
SafeMoon price has been coiling in a descending triangle formation since the May crash, with no high probability opportunities or upside momentum, reflecting a complete evacuation of investor interest. As descending triangles reflect a bearish bias among speculators, the outlook is tilted to the downside for the short-term.
SafeMoon price not concerned, but it should be
A descending triangle is a bearish chart formation that usually develops as a continuation pattern during a downtrend, indicating distribution. The horizontal line highlights demand that blocks the cryptocurrency from falling, while the declining trend line presents the increasing selling pressure.
The standard measured move rule for a descending triangle is to compute the height from the highest peak to the horizontal line and then add or subtract the amount to the breakout price (the point where price crosses the trend line) to get a price target. An alternative calculation is to take the amount and multiply it by the percentage of the breakouts meeting the target price. In the case of downside breakouts, 50% reach the target price.
The measured move is 57.21% based on the standard calculation, establishing a price target of $0.00000111. Alternatively, the second calculation gives a measured move of 28.64% and a price target of $0.00000186.
To trigger the descending triangle pattern, SafeMoon price needs to bust the emerging support offered by April’s descending trend line and log a daily close below $0.00000261, something it has not been able to accomplish. Once accomplished, SAFEMOON will get some support at the June 22 low of $0.00000230 before striking the first measured move price target of $0.00000186. If SafeMoon price subverts the support at $0.00000186, it may quickly drop to the April 21 low of $0.00000150 and potentially to the second measured move target of $0.00000111.
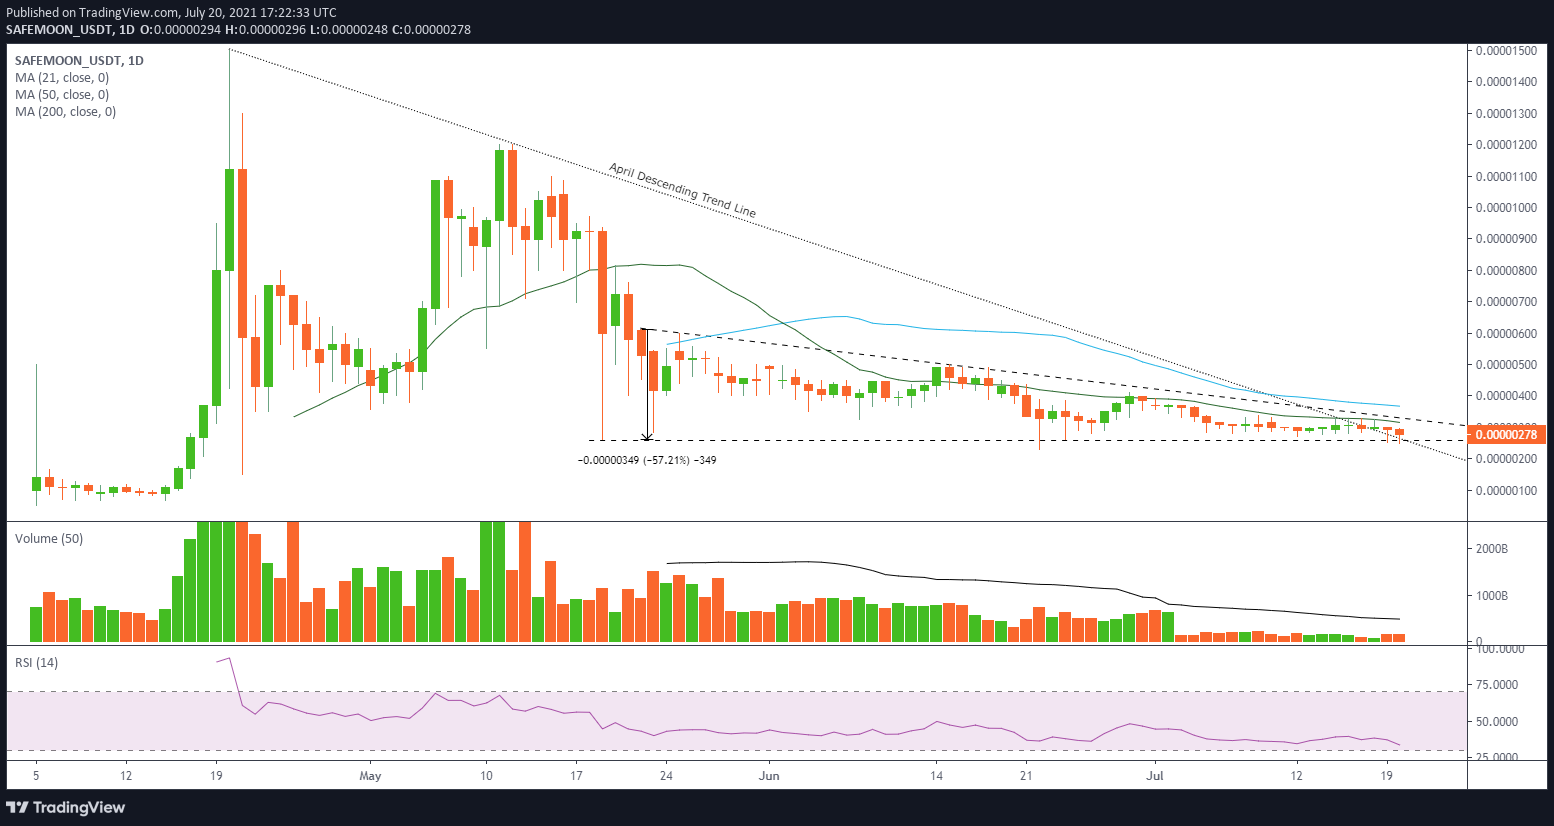
SAFEMOON/USD daily chart
An upward resolution of the pattern will need to overcome the 21-day SMA at $0.00000315, a moving average that has instructed SafeMoon price for almost a month. SAFEMOON will encounter more resistance at the triangle’s descending trend line at $0.00000330 and then the 50-day SMA at $0.00000367. Any further upside target needs to be assessed if the altcoin can reach the 50-day SMA.
SafeMoon price is on the edge of a considerable move. Still, the bearish bias of the descending triangle pattern combined with a deteriorating cryptocurrency complex tilts the probabilities in favor of a downward resolution of the pattern. To put it bluntly, it is a concerning situation for SAFEMOON speculators with the potential to unfold swiftly.
Note: All information on this page is subject to change. The use of this website constitutes acceptance of our user agreement. Please read our privacy policy and legal disclaimer. Opinions expressed at FXstreet.com are those of the individual authors and do not necessarily represent the opinion of FXstreet.com or its management. Risk Disclosure: Trading foreign exchange on margin carries a high level of risk, and may not be suitable for all investors. The high degree of leverage can work against you as well as for you. Before deciding to invest in foreign exchange you should carefully consider your investment objectives, level of experience, and risk appetite. The possibility exists that you could sustain a loss of some or all of your initial investment and therefore you should not invest money that you cannot afford to lose. You should be aware of all the risks associated with foreign exchange trading, and seek advice from an independent financial advisor if you have any doubts.
Recommended Content
Editors’ Picks

Shiba Inu eyes positive returns in April as SHIB price inches towards $0.000015
Shiba Inu's on-chain metrics reveal robust adoption, as addresses with balances surge to 1.4 million. Shiba Inu's returns stand at a solid 14.4% so far in April, poised to snap a three-month bearish trend from earlier this year.

AI tokens TAO, FET, AI16Z surge despite NVIDIA excluding crypto-related projects from its Inception program
AI tokens, including Bittensor and Artificial Superintelligence Alliance, climbed this week, with ai16z still extending gains at the time of writing on Friday. The uptick in prices of AI tokens reflects a broader bullish sentiment across the cryptocurrency market.

Bitcoin Weekly Forecast: BTC consolidates after posting over 10% weekly surge
Bitcoin price is consolidating around $94,000 at the time of writing on Friday, holding onto the recent 10% increase seen earlier this week. This week’s rally was supported by strong institutional demand, as US spot ETFs recorded a total inflow of $2.68 billion until Thursday.

XRP price could renew 25% breakout bid on surging institutional and retail adoption
Ripple price consolidates, trading at $2.18 at the time of writing on Friday, following mid-week gains to $2.30. The rejection from this weekly high led to the price of XRP dropping to the previous day’s low at $2.11, followed by a minor reversal.
Bitcoin Weekly Forecast: BTC consolidates after posting over 10% weekly surge
Bitcoin (BTC) price is consolidating around $94,000 at the time of writing on Friday, holding onto the recent 10% increase seen earlier this week.

The Best brokers to trade EUR/USD
SPONSORED Discover the top brokers for trading EUR/USD in 2025. Our list features brokers with competitive spreads, fast execution, and powerful platforms. Whether you're a beginner or an expert, find the right partner to navigate the dynamic Forex market.