SafeMoon Price Forecast: SAFEMOON continues its descent with minor upswings
- SafeMoon price has been on a steady downtrend since May 12 and shows no sign of stopping.
- The likelihood of an upswing diminished as SAFEMOON broke below the 50% Fibonacci retracement level at $0.00000397.
- A rejection at 100 four-hour SMA at $0.00000417 or lower might lead to a retest of the range low at $0.00000271.

SafeMoon price tried restarting the upswing as it bounced on May 23. However, this attempt was a failure as sellers pushed SAFEMOON lower.
The buyers will face a test around a critical resistance level, which will decide the direction for SafeMoon price for the upcoming weeks.
SafeMoon price lacks conviction
SafeMoon price has declined roughly 60% between May 21 and May 23 to create a swing low at $0.00000271. The recent rally that originated from the said level pushed SAFEMOON to $0.00000523, which is the range high.
Since this impulse wave, SafeMoon price has remained contained within the range. After a brief sideways movement around the 50% Fibonacci retracement level at $0.00000397, SAFEMOON dropped below it.
Now, a rejection at $0.00000397 or the 100 four-hour Simple Moving Average (SMA) at $0.00000417 will confirm the presence of sellers.
In that case, SafeMoon price is open to a 34% decline to retest the range low at $0.00000271.
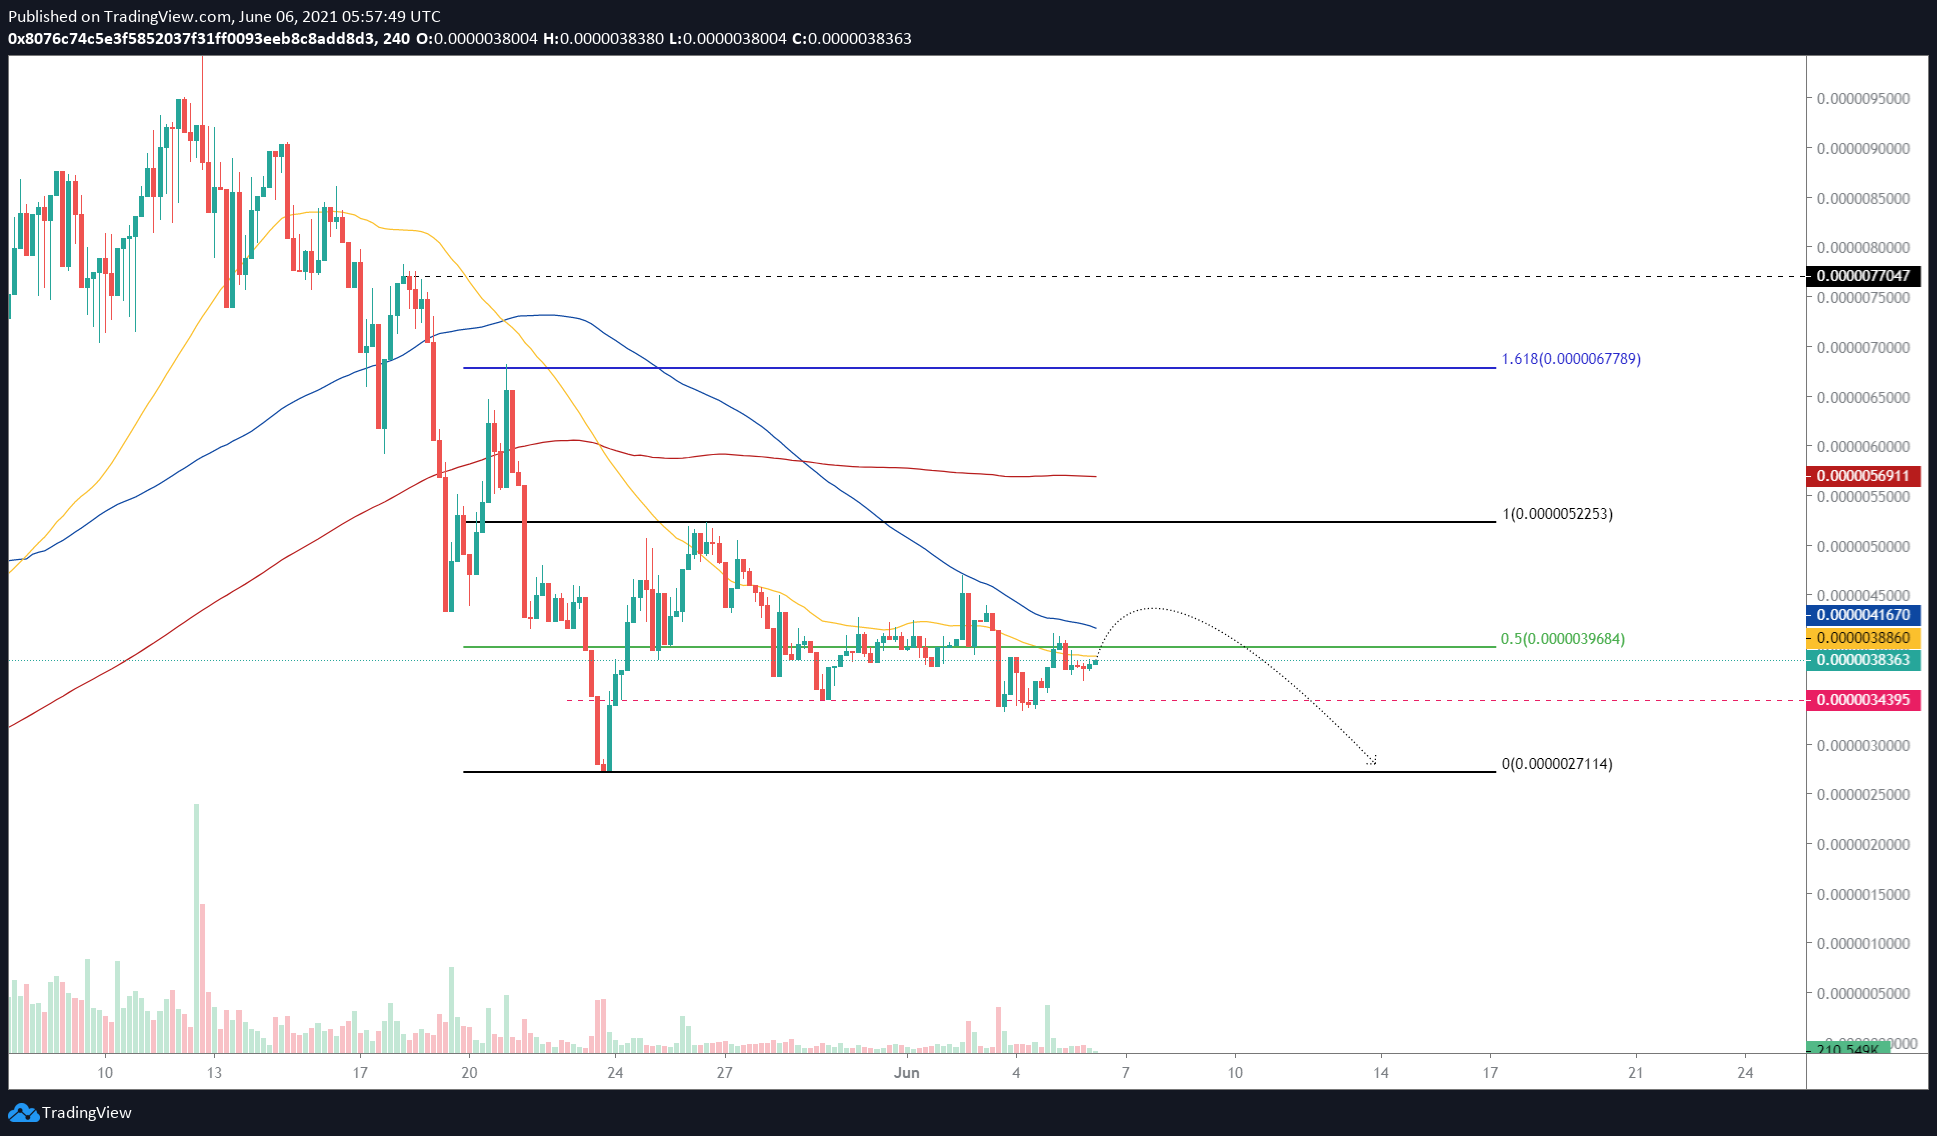
SAFEMOON/USDT 4-hour chart
On the other hand, if the buyers manage to produce a decisive close above the 100 four-hour SMA at $0.00000417, it will increase the chances of an upswing.
A new swing high above $0.00000456 will invalidate the bearish thesis detailed above and might kick-start an upswing to the range high at $0.000008523.
Under extremely bullish circumstances, SAFEMOON might make a run toward the 200 four-hour SMA at $0.00000569.
Author

Akash Girimath
FXStreet
Akash Girimath is a Mechanical Engineer interested in the chaos of the financial markets. Trying to make sense of this convoluted yet fascinating space, he switched his engineering job to become a crypto reporter and analyst.


