![]() Sheldon McIntyre, CMT
Sheldon McIntyre, CMT
Independent Analyst
- SafeMoon price squeeze failed to materialize, opting to sweep the May 19 low briefly.
- SAFEMOON 50 two-hour simple moving average (SMA) has turned lower, presenting a new resistance challenge.
- The two-hour Relative Strength Index (RSI) marks oversold reading for the first time since May 28.
SafeMoon price fails to build on the golden cross signal on June 16 as the weight of the deteriorating cryptocurrency complex plunged SAFEMOON to a new correction low. The initial recovery was impulsive, but the digital token has shifted into a consolidation with no discernible clues about the direction or magnitude of the future trend. Thus, even though SafeMoon price craves a new opportunity, caution is warranted until a broader wave of strength strikes the altcoin segment of the market.
SafeMoon price rebound does show a marginal level of trust in the rookie cryptocurrency
In a spirited attempt to induce a campaign to “pop off” SafeMoon price on June 21, Reddit user “GMEandAMCbroughtme” on r/SatoshiStreetBets, encouraged SAFEMOON followers to create a crypto version of Gamestop and AMC. Unfortunately, the “biggest squeeze of all time” did not materialize as the altcoin fell below the May 19 low the following day, losing 20% on the two-hour candlestick.
The initial turn higher brought forth by the SafeMoon price strength during June 13-15 was respected by the 200 two-hour SMA, lending credibility to a mildly bullish outlook for SAFEMOON. However, after the turn lower, the longer-term moving average combined with the 50 two-hour SMA at $0.00000371 now presents formidable resistance if the digital asset chooses to break free from the minor consolidation.
Nevertheless, as long as SafeMoon price remains above the May 25 declining trend line, investors can maintain their attention on a timely entry price from the long side. Based on the current price structure on the two-hour chart, the optimal point to initiate a long position would be a close above the 200 two-hour SMA at $0.00000408. Yes, it is approximately 20% from the current price, but it is a small cost to pay to achieve a higher probability opportunity in SAFEMOON.
Above the 200 two-hour SMA, the targets include the June 15 high of $0.00000500, the May 25 high of $0.00000598 and finally, the 38.2% Fibonacci retracement of the May correction at $0.00000620, returning 50% to disciplined investors and sealing a new opportunity.
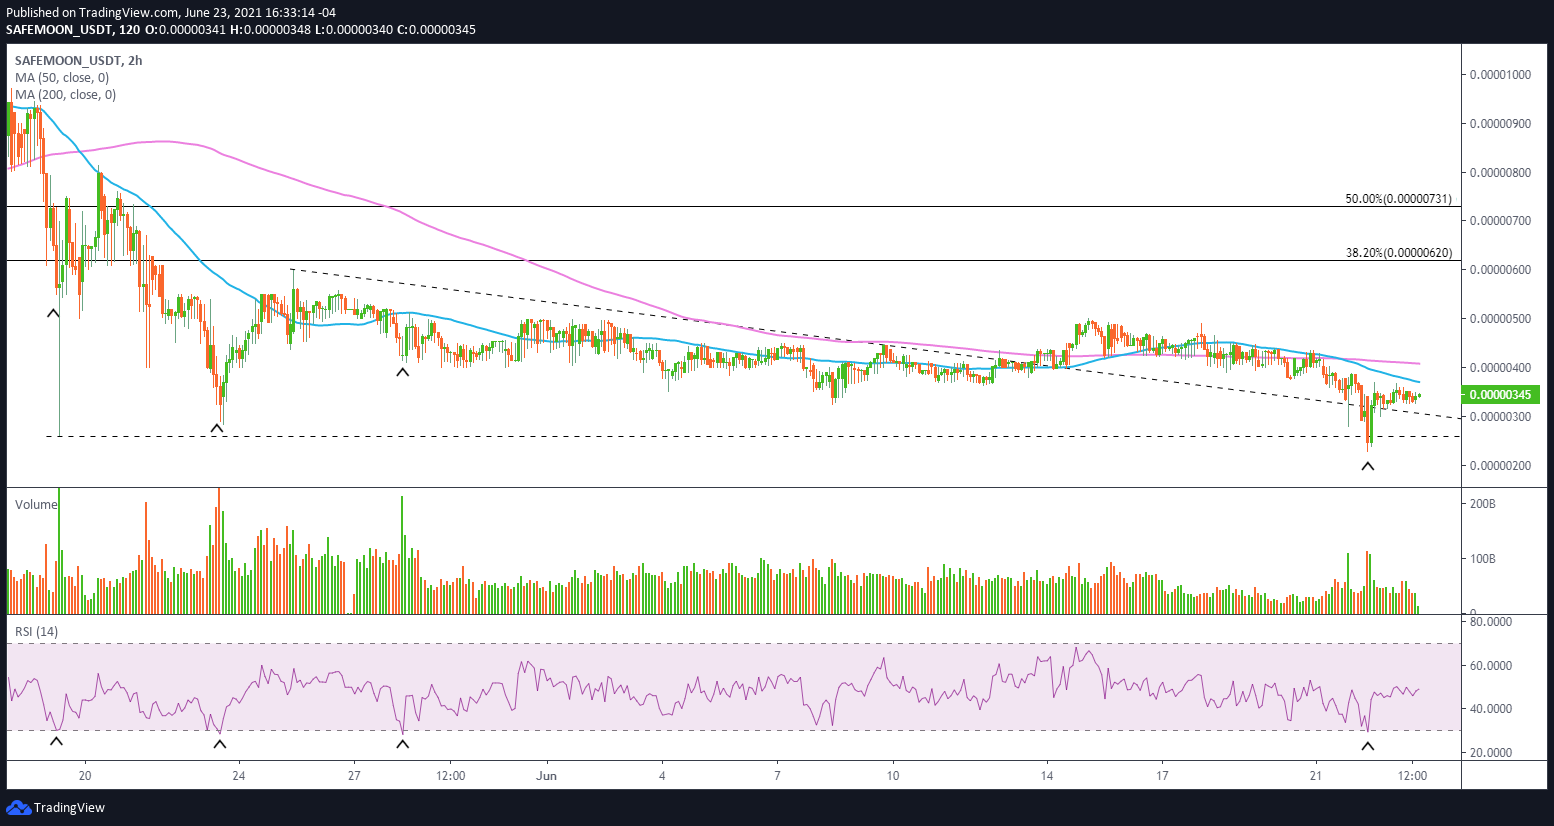
SAFEMOON/USDT 2-hour chart
A close below the May 25 declining trend line, now at $0.00000308, will raise the potential of another test of the May 19 low of $0.00000261. It may come as a surprise in light of the oversold condition dictated by the two-hour RSI, but it should be noted that only one of the last three oversold readings resulted in a notable rebound for SAFEMOON. Thus, suggesting that a rally may not be on the horizon.
The worst-case scenario for SafeMoon price is an unstoppable plunge towards the April 21 low of $0.00000150, realizing a decline of over 50% from the current price.
At this moment, SafeMoon price appears to be in a lengthy bottoming process following the May correction, marked by stubborn moving average resistance, unremarkable levels of accumulation, and a general tendency to follow the cryptocurrency market trend. Therefore, when SAFEMOON can originate relative strength by exceeding outstanding resistance levels, market operators can feel more comfortable commencing trading operations in the rookie cryptocurrency.
Note: All information on this page is subject to change. The use of this website constitutes acceptance of our user agreement. Please read our privacy policy and legal disclaimer. Opinions expressed at FXstreet.com are those of the individual authors and do not necessarily represent the opinion of FXstreet.com or its management. Risk Disclosure: Trading foreign exchange on margin carries a high level of risk, and may not be suitable for all investors. The high degree of leverage can work against you as well as for you. Before deciding to invest in foreign exchange you should carefully consider your investment objectives, level of experience, and risk appetite. The possibility exists that you could sustain a loss of some or all of your initial investment and therefore you should not invest money that you cannot afford to lose. You should be aware of all the risks associated with foreign exchange trading, and seek advice from an independent financial advisor if you have any doubts.
Recommended Content
Editors’ Picks

Bitcoin holds $84,000 despite Fed’s hawkish remarks and spot ETFs outflows
Bitcoin is stabilizing around $84,000 at the time of writing on Thursday after facing multiple rejections around the 200-day EMA at $85,000 since Saturday. Despite risk-off sentiment due to the hawkish remarks by the US Fed on Wednesday, BTC remains relatively stable.

Crypto market cap fell more than 18% in Q1, wiping out $633.5 billion after Trump’s inauguration top
CoinGecko’s Q1 Crypto Industry Report highlights that the total crypto market capitalization fell by 18.6% in the first quarter, wiping out $633.5 billion after topping on January 18, just a couple of days ahead of US President Donald Trump’s inauguration.

Top meme coin gainers FARTCOIN, AIDOGE, and MEW as Trump coins litmus test US SEC ethics
Cryptocurrencies have been moving in lockstep since Monday, largely reflecting sentiment across global markets as United States (US) President Donald Trump's tariffs and trade wars take on new shapes and forms each passing day.

XRP buoyant above $2 as court grants Ripple breathing space in SEC lawsuit
A US appellate court temporarily paused the SEC-Ripple case for 60 days, holding the appeal in abeyance. The SEC is expected to file a status report by June 15, signaling a potential end to the four-year legal battle.
Bitcoin Weekly Forecast: Market uncertainty lingers, Trump’s 90-day tariff pause sparks modest recovery
Bitcoin (BTC) price extends recovery to around $82,500 on Friday after dumping to a new year-to-date low of $74,508 to start the week. Market uncertainty remains high, leading to a massive shakeout, with total liquidations hitting $2.18 billion across crypto markets.

The Best brokers to trade EUR/USD
SPONSORED Discover the top brokers for trading EUR/USD in 2025. Our list features brokers with competitive spreads, fast execution, and powerful platforms. Whether you're a beginner or an expert, find the right partner to navigate the dynamic Forex market.