![]() Sheldon McIntyre, CMT
Sheldon McIntyre, CMT
Independent Analyst
- SafeMoon price continues to oscillate within a descending channel formation on the four-hour chart.
- Declining 50 four-hour simple moving average (SMA) providing resistance since May 31.
- 40% gain is possible if May’s declining trend line is conquered.
SafeMoon price evolution since May 25 has tested the patience of bullish investors. The rookie digital asset has not commanded sustainable buying pressure, instead staying locked in a descending channel offering brief swing trading opportunities. Until SafeMoon price can free itself from the channel and reignite SAFEMOON enthusiasm, investors should be content with minor double-digit returns.
SafeMoon price weighed down by broader crypto market woes
SAFEMOON was launched on March 21 with a SafeMoon price of $.0000000010, and it reached $0.00001500 on April 20, rewarding the first adopters with an astronomical return. The magnitude and speed of the advance captured headlines, lifting the number of users to over one million.
The market capitalization currently rests at $2.23 billion, ranking it #204 in the cryptocurrency rankings with over 585 trillion tokens in circulation, according to CoinMarketCap. It is relatively inexpensive compared to most digital assets allowing investors to amass positions in the millions of SAFEMOON.
SAFEMOON developers can burn tokens manually with the logic that a smaller supply will drive up the price. In the protocol whitepaper, SAFEMOON state that it “aims to implement a burn strategy that is beneficial and rewarding for those engaged for the long term.”
SAFEMOON is not listed on the major cryptocurrency exchanges, so enthusiastic investors need to access it on the decentralized PancakeSwap exchange.
Currently, SafeMoon price has fallen into a descending channel, replacing the sharp downtrend into the May 23 low. The channel has remained below the declining 50 four-hour SMA, and the volume underpinning the formation has been below average.
A breakout above the channel’s upper boundary at $0.00000476 should ignite a rally to the May 11 declining trend line at $0.00000565 and then the 38.2% retracement of the May correction at $0.00000620.
The 200 four-hour SMA at $0.00000668 will be an epic confrontation, considering that it resisted the rebound attempt from the May 19 low. It would still represent a 40% gain from the channel’s upper boundary as of today.
Ambitious SAFEMOON investors should target the 50% retracement at $0.00000731 and then the 61.8% retracement at $0.00000841, which aligns with considerable price congestion gathered from May 6 to May 18.
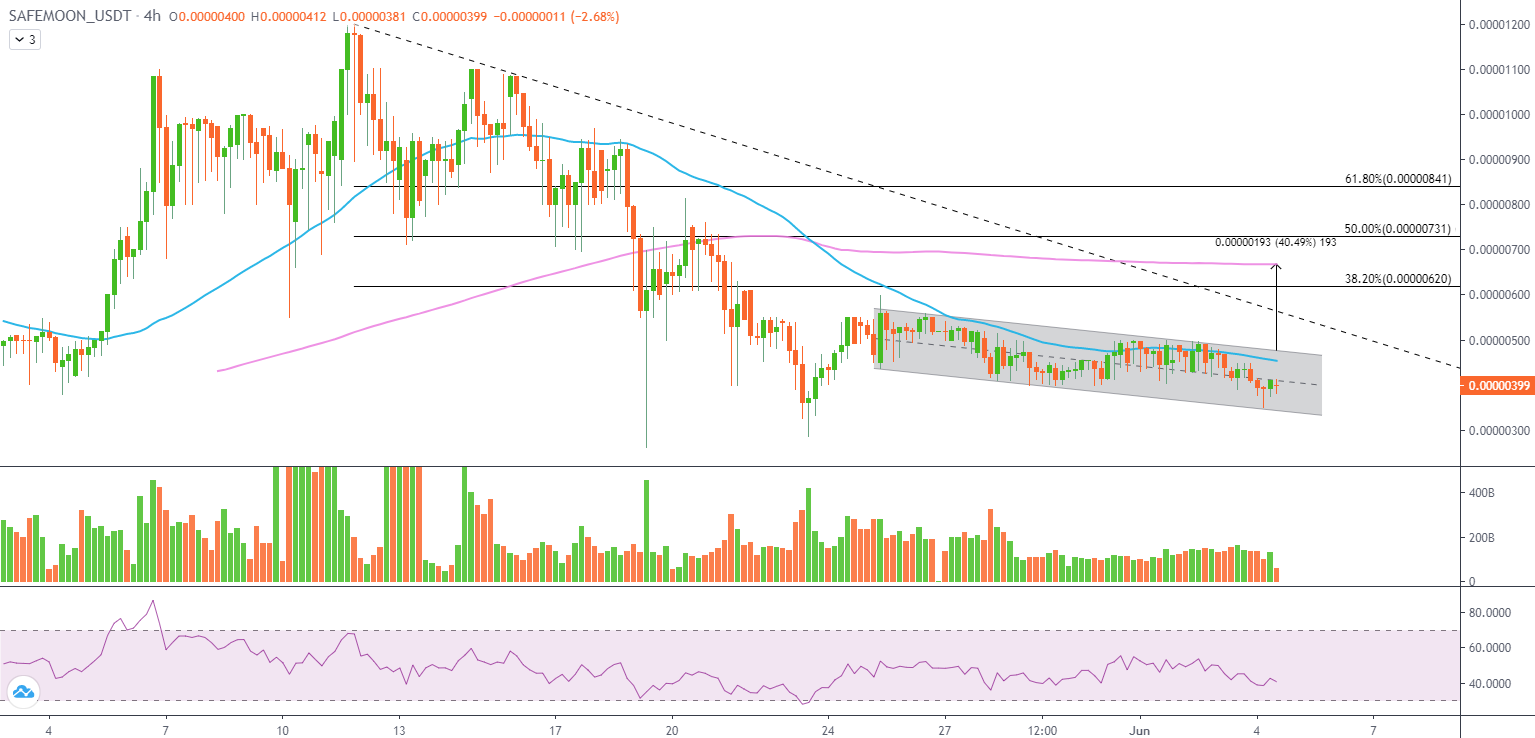
SAFEMOON/USD 4-hour chart
After tagging the all-time high at $0.00001500 on April 20, SafeMoon price collapsed 90% as FOMO exited the building. Based on that experience, investors need to be prepared for the downside.
A four-hour close below the channel’s lower boundary at $0.00000341 would alert investors to anticipate a test of the May 23 low at $0.00000285 and the May 19 low at $0.00000261, leaving a 35% decline for the undisciplined market operators.
SafeMoon price is defining a price history and personality, searching for the next wave of brave investors and hype to transform it into a mainstay digital asset, such as what occurred with DOGE. For now, SAFEMOON will be attached to the trendless conditions of the larger cryptocurrency market until that comes to fruition.
Note: All information on this page is subject to change. The use of this website constitutes acceptance of our user agreement. Please read our privacy policy and legal disclaimer. Opinions expressed at FXstreet.com are those of the individual authors and do not necessarily represent the opinion of FXstreet.com or its management. Risk Disclosure: Trading foreign exchange on margin carries a high level of risk, and may not be suitable for all investors. The high degree of leverage can work against you as well as for you. Before deciding to invest in foreign exchange you should carefully consider your investment objectives, level of experience, and risk appetite. The possibility exists that you could sustain a loss of some or all of your initial investment and therefore you should not invest money that you cannot afford to lose. You should be aware of all the risks associated with foreign exchange trading, and seek advice from an independent financial advisor if you have any doubts.
Recommended Content
Editors’ Picks

Grayscale files S-3 form for Digital Large Cap ETF comprising Bitcoin, Ethereum, XRP, Solana, and Cardano
Grayscale, a leading digital asset manager operating the GBTC ETF, has filed the S-3 form with the United States (US) Securities and Exchange Commission (SEC) in favor of a Digital Large Cap ETF.

Top 3 Price Prediction Bitcoin, Ethereum, Ripple: BTC, ETH, and XRP brace for volatility amid Trump’s ‘Liberation Day’
Bitcoin price faces a slight rejection around its $85,000 resistance level on Wednesday after recovering 3.16% the previous day. Ripple follows BTC as it falls below its critical level, indicating weakness and a correction on the horizon.

Top crypto news: VanEck hints at BNB ETF, Circle files S-1 application for IPO
Asset manager VanEck registered a BNB Trust in Delaware on Tuesday, marking its intention to register for an ETF product with the Securities & Exchange Commission (SEC).

Solana Price Forecast for April 2025: SOL traders risk $120 reversal as FTX begins $800M repayments on May 30
Solana price consolidated below $130 on Tuesday, facing mounting headwinds in April as investors grow wary of looming FTX sell-offs.

Bitcoin: BTC remains calm before a storm
Bitcoin's price has been consolidating between $85,000 and $88,000 this week. A K33 report explains how the markets are relatively calm and shaping up for volatility as traders absorb the tariff announcements. PlanB’s S2F model shows that Bitcoin looks extremely undervalued compared to Gold and the housing market.

The Best brokers to trade EUR/USD
SPONSORED Discover the top brokers for trading EUR/USD in 2025. Our list features brokers with competitive spreads, fast execution, and powerful platforms. Whether you're a beginner or an expert, find the right partner to navigate the dynamic Forex market.