Ripple's XRP Technical Analysis: XRP/USD tug of war
- Ripple's XRP was nursing losses of around 2.5% into the second half of the session on Friday.
- XRP/USD bulls are playing tug of war with bears, with the price moving in and out of the pennant pattern formation.
- The above-mentioned could see a drop down towards $0.30-0.25 should the bears win.

XRP/USD daily chart
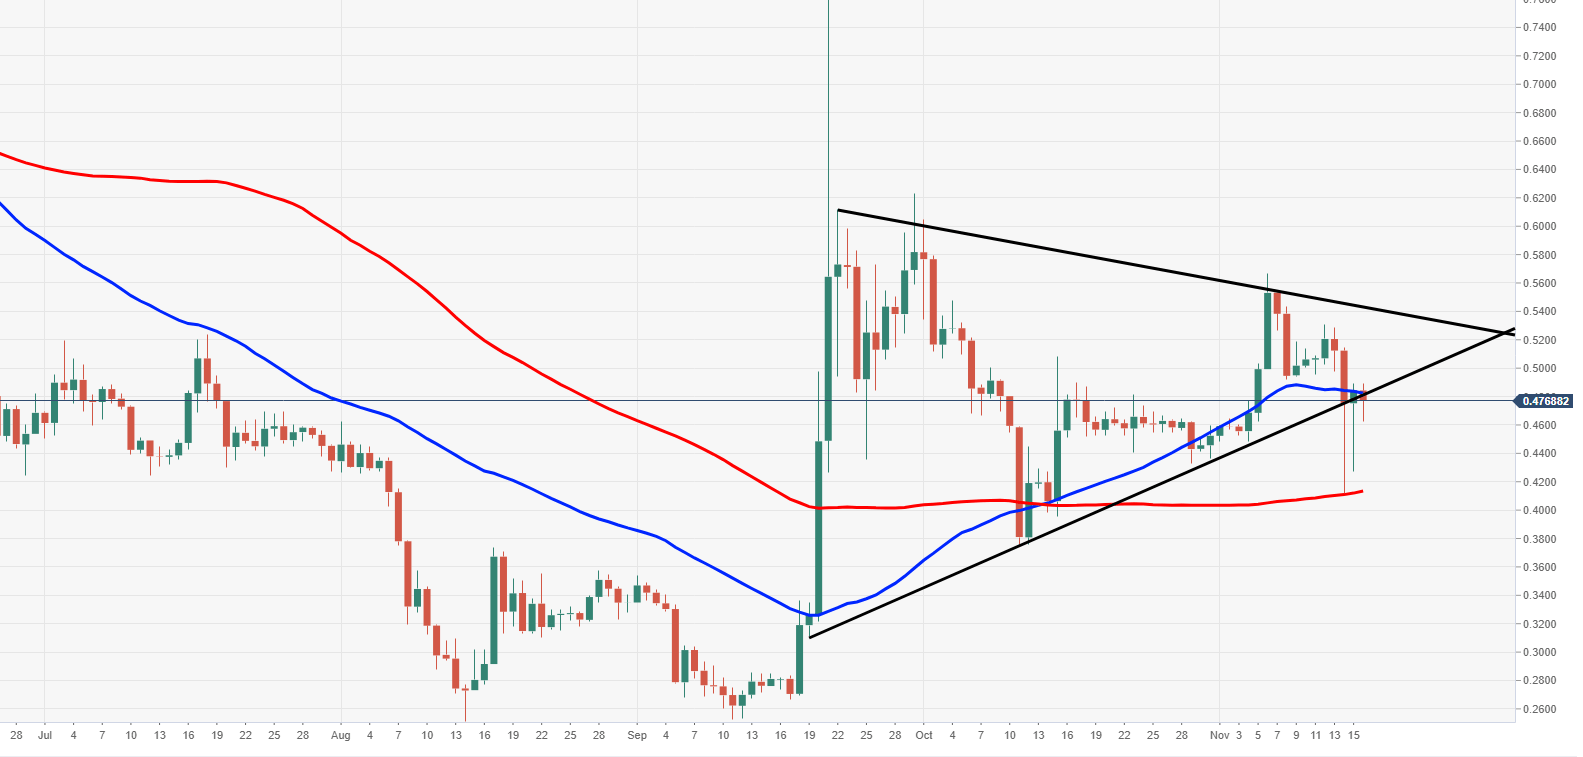
Spot rate: 0.4783
Relative change: -2.50%
High: 0.4888
Low: 0.4627
Trend: Bearish
Support 1: 0.4445, daily pivot point support & demand zone.
Support 2: 0.4047, daily pivot point support.
Support 3: 0.3824, daily pivot point support.
Resistance 1: 0.4837, 50DMA.
Resistance 2: 0.5067, daily pivot point resistance.
Resistance 3: 0.5290, daily pivot point resistance.
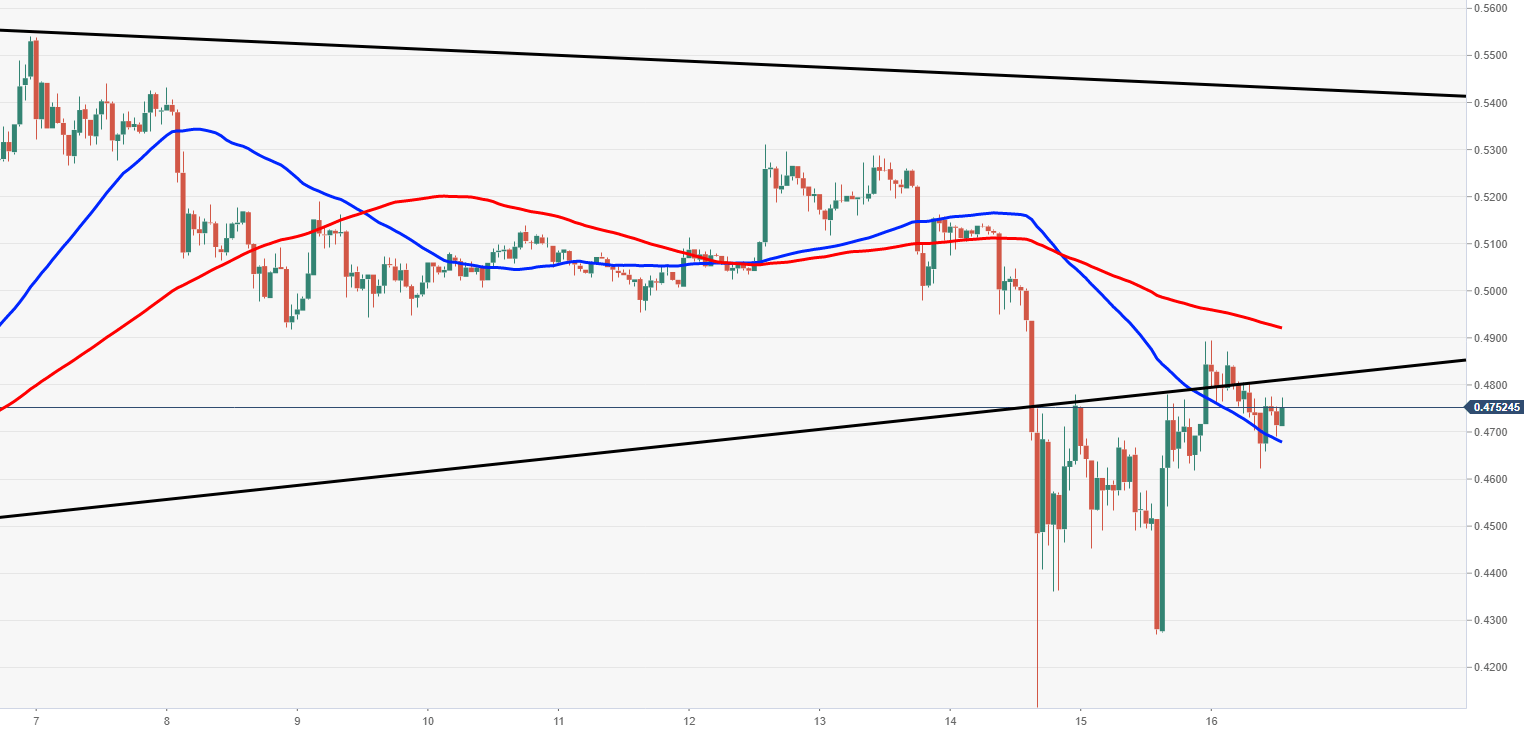
XRP/USD 60-minute chart
- As seen via the 60-minute chart view, price action is flirting in and around the lower trend line of the pennant pattern.
Author

Ken Chigbo
Independent Analyst
Ken has over 8 years exposure to the financial markets. He started his career as an analyst, covering a variety of asset classes; forex, fixed income, commodities and equities.


