|

Ripple's XRP technical analysis: XRP/USD subject to a breakout from bearish pennant structure

  • Ripple's XRP price is trading in the red on Monday, holding losses of some 0.70%.
  • XRP/USD is moving within the confinements of a bearish pennant structure via the daily. 
  • The big psychological $0.3000 mark remains vulnerable of giving way to the bears. 

Spot rate:                 0.3091

Relative change:      -0.05%

High:                         0.3141

Low:                          0.3062

XRP/USD

Overview
Today last price0.3096
Today Daily Change-0.0019
Today Daily Change %-0.61
Today daily open0.3115
 
Trends
Daily SMA200.3243
Daily SMA500.3812
Daily SMA1000.3716
Daily SMA2000.3454
Levels
Previous Daily High0.3146
Previous Daily Low0.2991
Previous Weekly High0.3354
Previous Weekly Low0.3027
Previous Monthly High0.5074
Previous Monthly Low0.3704
Daily Fibonacci 38.2%0.3087
Daily Fibonacci 61.8%0.3051
Daily Pivot Point S10.3022
Daily Pivot Point S20.2929
Daily Pivot Point S30.2867
Daily Pivot Point R10.3177
Daily Pivot Point R20.3239
Daily Pivot Point R30.3332

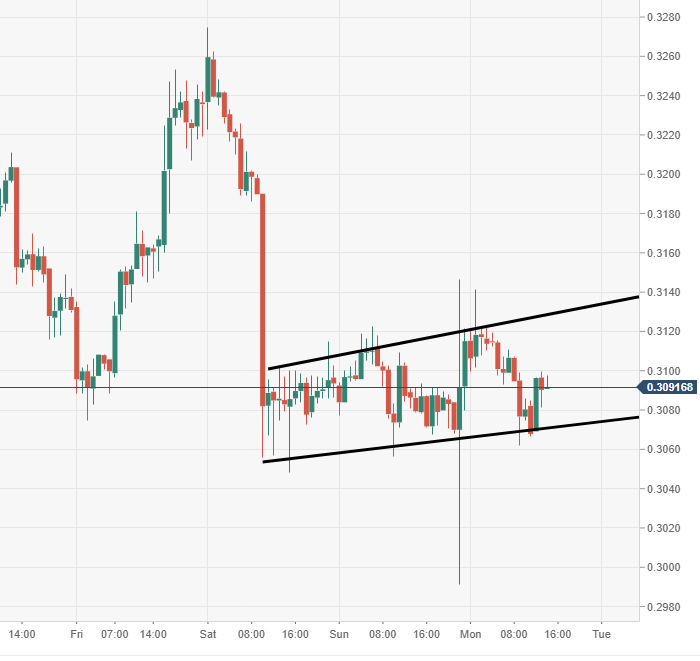
XRP/USD 60-minute chart

  • The price via the 60-minute is moving within a bearish flag structure, vulnerable to downside risks. 
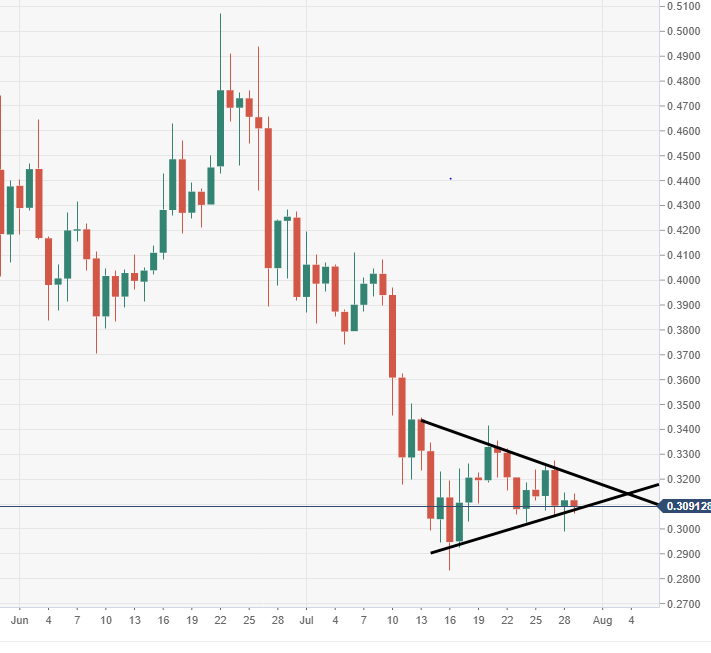
XRP/USD daily chart

  • Price action has been moving within the confinements of a bearish pennant structure. 

Author

Ken Chigbo

Ken Chigbo

Independent Analyst

Ken has over 8 years exposure to the financial markets. He started his career as an analyst, covering a variety of asset classes; forex, fixed income, commodities and equities.

More from Ken Chigbo
Share:

Editor's Picks

Ripple bulls defend key support amid waning retail demand and ETF inflows

XRP ticks up above $1.40 support, but waning retail demand suggests caution. XRP attracts $4 million in spot ETF inflows on Thursday, signaling renewed institutional investor interest.

Crypto Today: Bitcoin, Ethereum, XRP rebound as risk appetite improves

Bitcoin rises marginally, nearing the immediate resistance of $68,000 at the time of writing on Friday. Major altcoins, including Ethereum and Ripple, hold key support levels as bulls aim to maintain marginal intraday gains.

Bitcoin Weekly Forecast: No recovery in sight 

Bitcoin price continues to trade sideways between $65,729 and $71,746, extending its consolidation since February 7. US-spot ETFs record an outflow of $403.90 million through Thursday, pointing to the fifth consecutive week of withdrawals.

Pi Network Price Forecast: PI recovery stalls amid profit-taking

Pi Network tests 50-day EMA support on Friday, after a 5% decline the previous day. PiScan data shows large deposits on CEXs totaling over 4 million PI tokens in the last 24 hours, reflecting an exodus of investors taking profits.

Bitcoin Price Annual Forecast: BTC holds long-term bullish structure heading into 2026

Bitcoin (BTC) is wrapping up 2025 as one of its most eventful years, defined by unprecedented institutional participation, major regulatory developments, and extreme price volatility.

Bitcoin: No recovery in sight

Bitcoin (BTC) price continues to trade within a range-bound zone, hovering around $67,000 at the time of writing on Friday, and falling slightly so far this week, with no signs of recovery.