|

Ripple's XRP Technical Analysis: XRP/USD is testing critical support area

  • Ripple's price on Friday is trading up in marginal positive territory, holding minor gains of just some 0.40%. 
  • XRP/USD moving within a range-block formation, as seen across the market with some of its peers. 

XRP/USD 15-minute chart

  • As can be clearly highlighted on the 15-minute view, an ascending channel formation. When viewed on via the 60-minute chart, looks to be a bearish flag. 
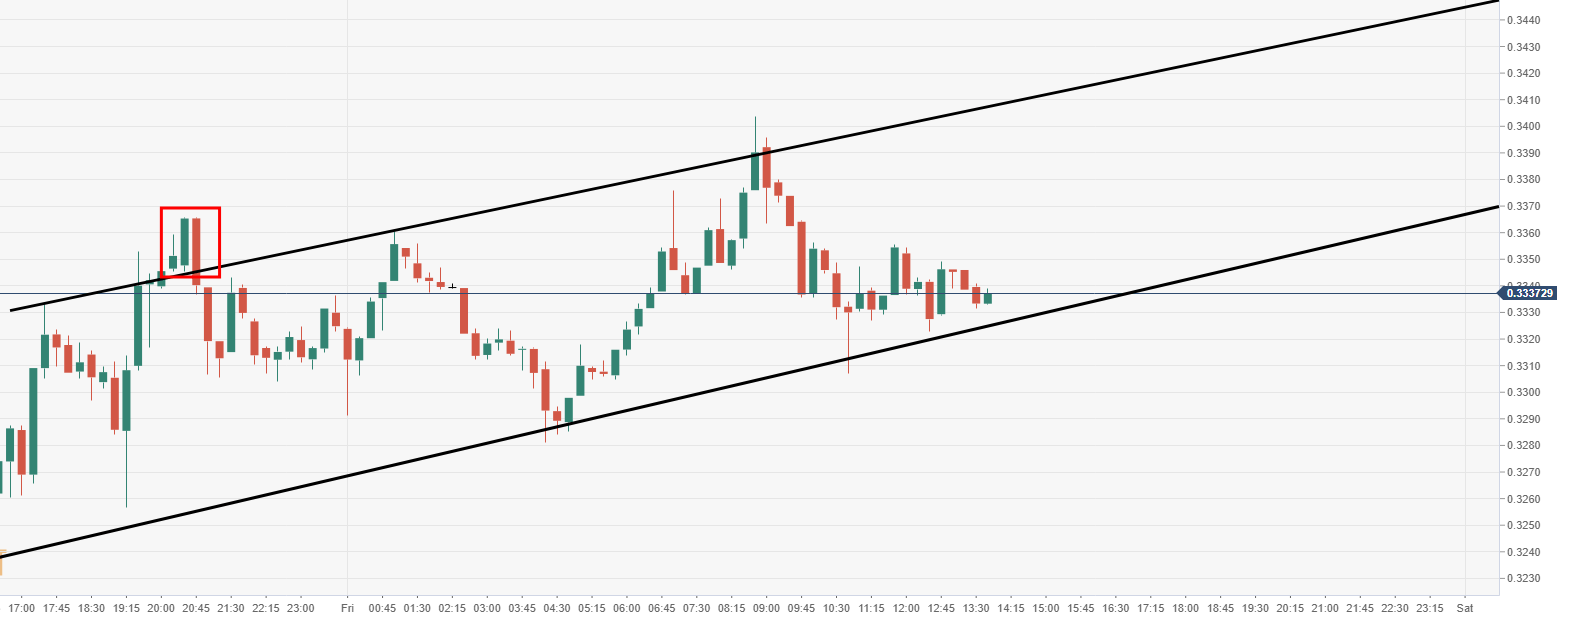
Spot rate:                  0.3905

Relative change:      +0.38%

High:                         0.3403

Low:                          0.3281

Trend:                        Bearish 

Support 1:                  0.3064, daily pivot point support.

Support 2:                  0.2803, daily pivot point support.

Support 3:                  0.2382, daily pivot point support.

Resistance 1:             0.3746, daily pivot point resistance.

Resistance 2:             0.4167, daily pivot point resistance.

Resistance 3:             0.4428, daily pivot point resistance.

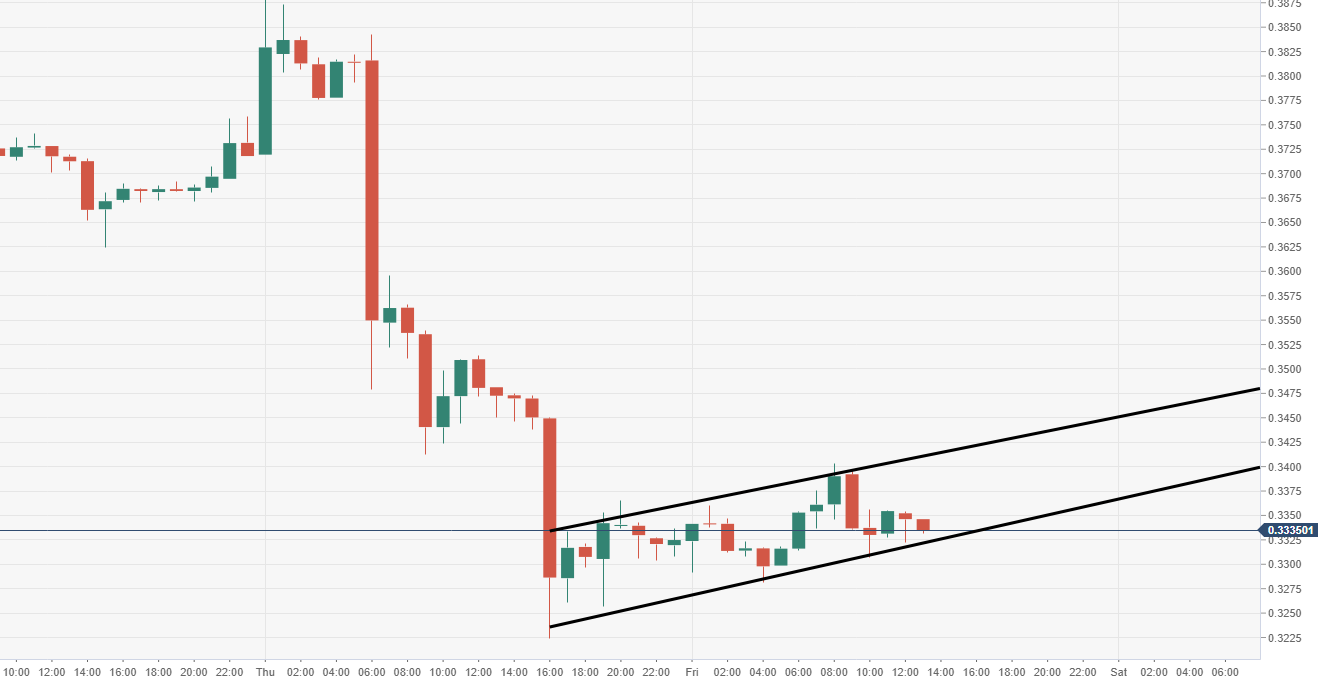
XRP/USD 60-minute chart

  • XRP/USD appears to have shaped up a bearish flag pattern formation, subject to an extended break lower.
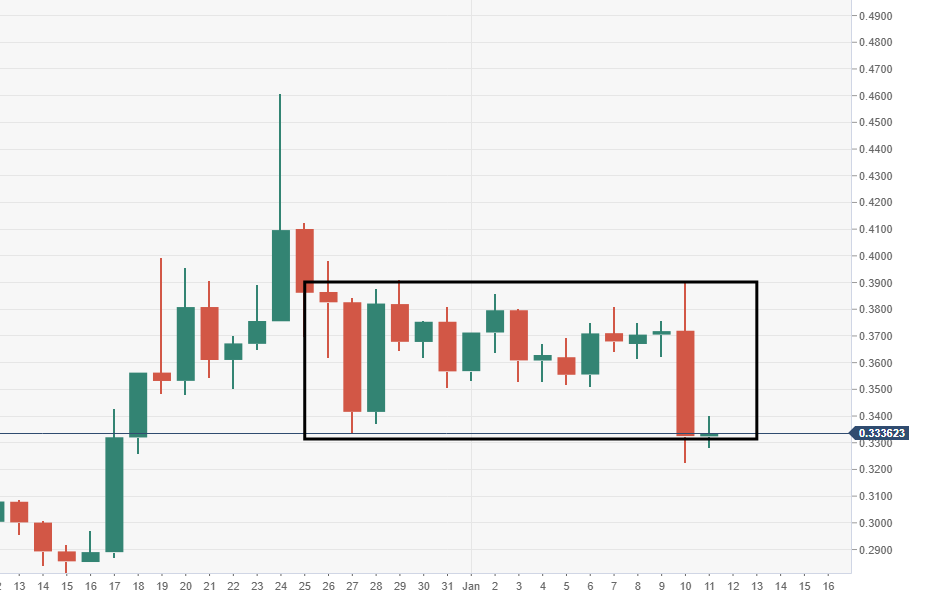
XRP/USD daily chart

  • Price action is testing the lower part of a critical daily range-block formation. 

Author

Ken Chigbo

Ken Chigbo

Independent Analyst

Ken has over 8 years exposure to the financial markets. He started his career as an analyst, covering a variety of asset classes; forex, fixed income, commodities and equities.

More from Ken Chigbo
Share:

Editor's Picks

XRP sell-off deepens amid weak retail interest, risk-off sentiment

Ripple (XRP) is edging lower around $1.36 at the time of writing on Wednesday, weighed down by low retail interest and macroeconomic uncertainty, which is accelerating risk-off sentiment.

Crypto Today: Bitcoin, Ethereum, XRP extend sell-off amid negative funding rates 

Bitcoin is down 15% in February and looks poised to extend its losses toward the yearly low of $60,000. Ethereum and Ripple are following in Bitcoin's footsteps, weighed down by a weak derivatives market. 

Hyperliquid tests key support as sell-side pressure intensifies

Hyerliquid (HYPE) drops to its 50-day Exponential Moving Average (EMA) at $28.85 at the time of writing on Wednesday, extending a decline of roughly 10% so far this week. 

Stellar Price Forecast: XLM risks revisiting $0.136 as sell-off continues

Stellar is trading below $0.160 at the time of writing on Wednesday, extending its correction for the fifth consecutive day. The bearish price action is further supported by rising short bets and declining Open Interest in the derivatives market. 

Bitcoin Price Annual Forecast: BTC holds long-term bullish structure heading into 2026

Bitcoin (BTC) is wrapping up 2025 as one of its most eventful years, defined by unprecedented institutional participation, major regulatory developments, and extreme price volatility.

Bitcoin: The worst may be behind us

Bitcoin (BTC) price recovers slightly, trading at $65,000 at the time of writing on Friday, after reaching a low of $60,000 during the early Asian trading session. The Crypto King remained under pressure so far this week, posting three consecutive weeks of losses exceeding 30%.