Ripple's XRP Technical Analysis: XRP/USD critical demand zone in play $0.3500-0.3400, a break will call upon $0.3000
- Ripple's XRP is being hammered on Thursday, down a big 6.7% in the mid-part of the session.
- XRP/USD after being part of a market wide bear attack, remains vulnerable to further downside risks.

XRP/USD 15-minute chart
- XRP/USD price action consolidating around session lows for now, subject to further downside risks.
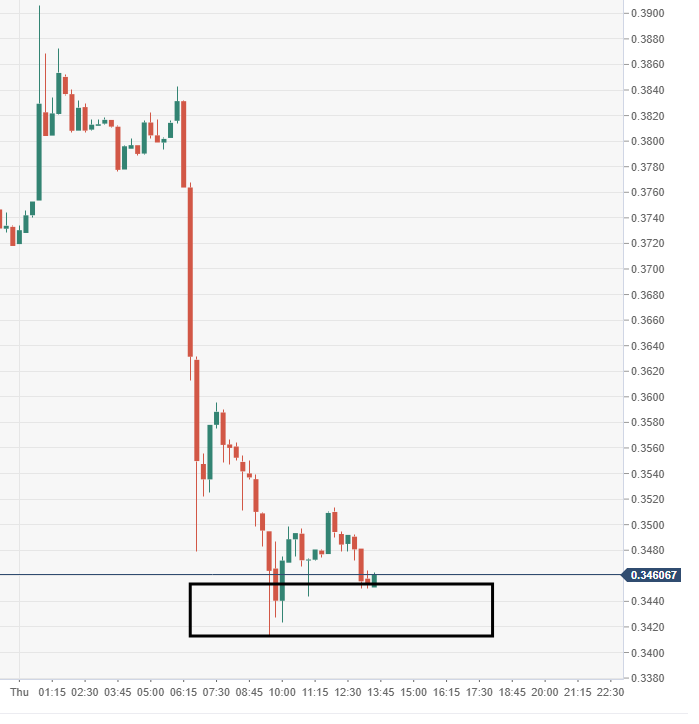
Spot rate: 0.3460
Relative change: -1.83%
High: 0.3906
Low: 0.3412
Trend: Neutral
Support 1: 0.3642, daily pivot point support.
Support 2: 0.3566, daily pivot point support.
Support 3: 0.3508, daily pivot point support.
Resistance 1: 0.3776, daily pivot point resistance.
Resistance 2: 0.3835, daily pivot point resistance.
Resistance 3: 0.3911, daily pivot point resistance.
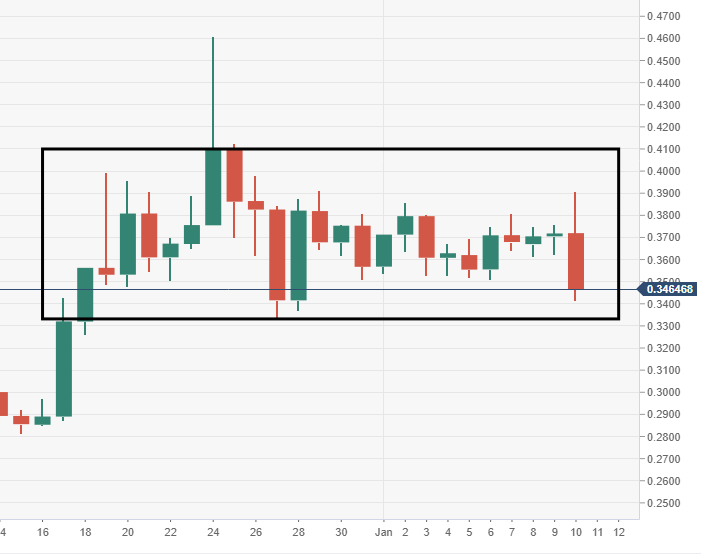
XRP/USD 4-hour chart
- Price action is being heavily supported by a demand zone seen tracking from $0.3400-0.3300 This has been in play since mid-December.
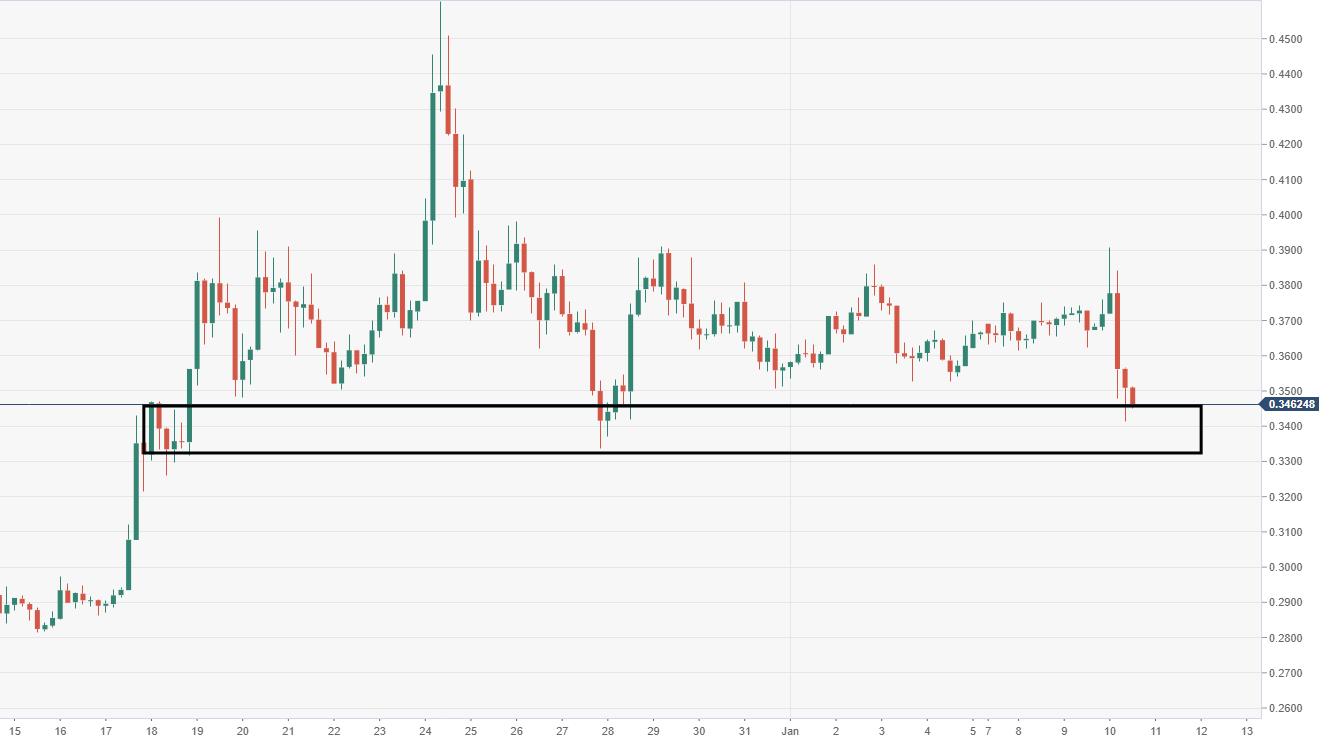
XRP/USD daily chart
- Over the daily time frame, XRP/USD is stuck within a range-block formation.
Author

Ken Chigbo
Independent Analyst
Ken has over 8 years exposure to the financial markets. He started his career as an analyst, covering a variety of asset classes; forex, fixed income, commodities and equities.


