Ripple's XRP Technical Analysis: XRP/USD dangerous consolidation mode
- Ripple's XRP price is trading firmly in the red, down over 5% in the session on Thursday,
- XRP/USD price action is moving within a pennant pattern, subject to a breakout to the downside.
- Ripple announced another partnership, large Asian bank, CIMB Group will be utilizing Ripple's technology.
- Losses are not as harsh as some of XRP's peers seen across the market.

XRP/USD 30-minute chart
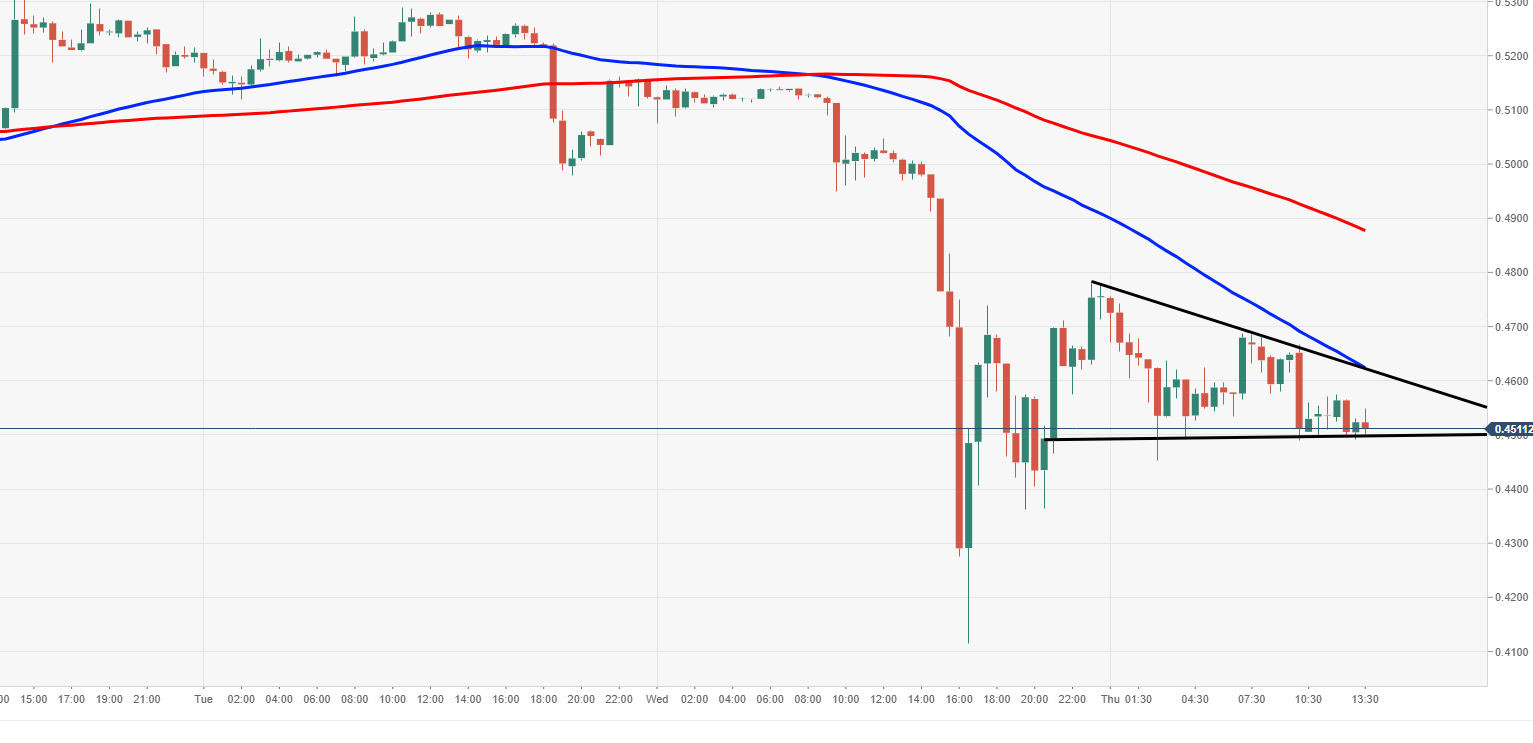
Spot rate: 0.4508
Relative change: -5.94%
High: 0.4755
Low: 0.4454
Trend: Bearish
Support 1: 0.4502, lower support of pennant.
Support 2: 0.4200, daily pivot point support.
Support 3: 0.3643, daily pivot point support.
Resistance 1: 0.4621, upper part of pennant & 50MA.
Resistance 2: 0.4875, 100MA.
Resistance 3: 0.5000, psychological level.
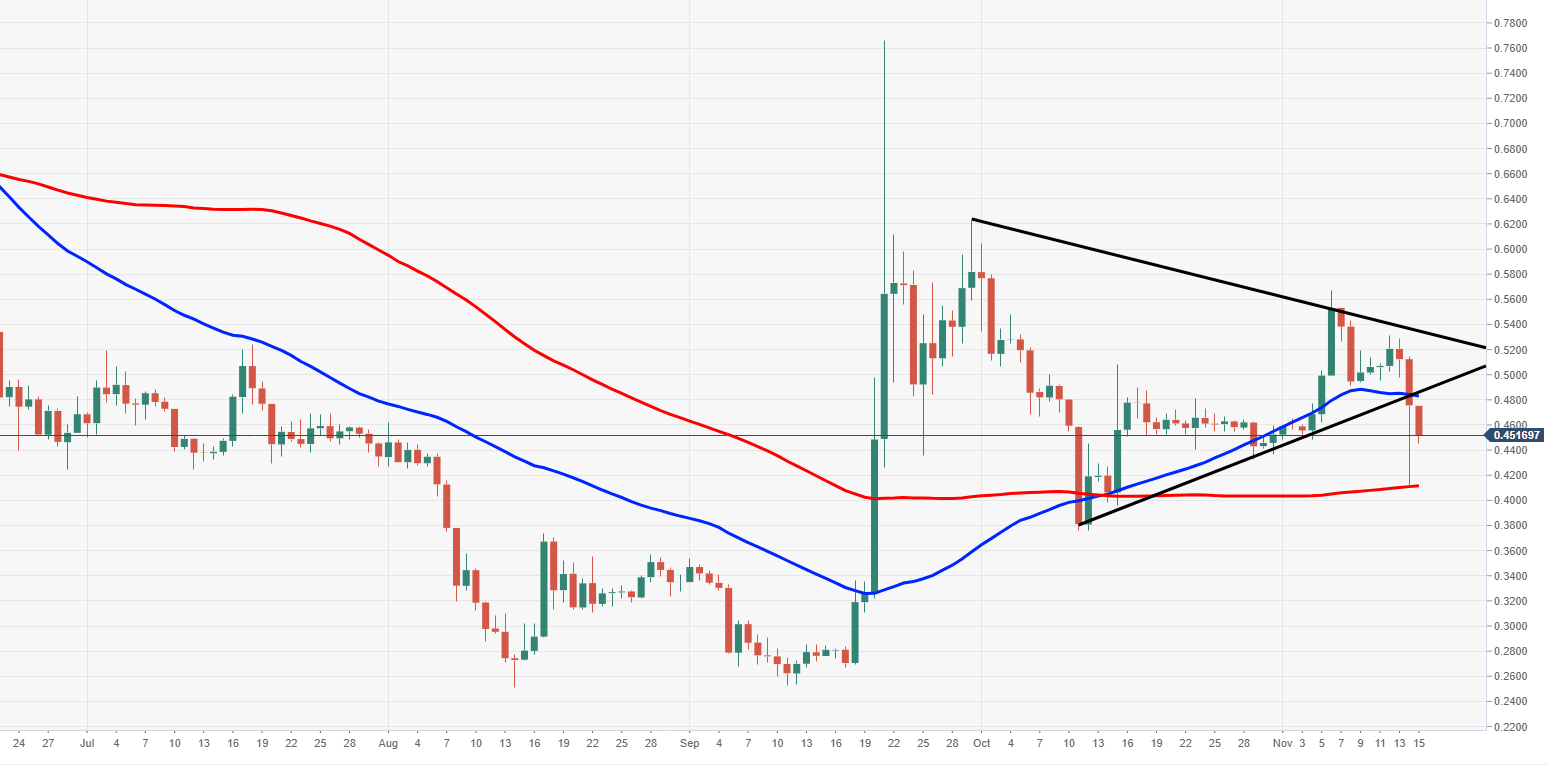
XRP/USD daily chart
- Price broken out from a triangular pattern formation via the daily view, vital support in play at the 100DMA.
Author

Ken Chigbo
Independent Analyst
Ken has over 8 years exposure to the financial markets. He started his career as an analyst, covering a variety of asset classes; forex, fixed income, commodities and equities.


