• Ripple’s range trade extends into the seventh day on Saturday.
  • The spot looks promising but above the 21-DMA barrier.
  • RSI on the daily chart holds in the bearish territory.

Ripple (XRP/USD) is trying hard to build onto Friday’s gains, as the week-long range paly extends into Saturday. The bulls lack vigor and await a fresh trading impetus to take on the upside. US traders are away, celebrating the Independence Day extended weekend. At the time of writing, the fourth-most favorite cryptocurrency trades with small gains around 0.1775 but remains on track to book about 2.50% weekly loss. Its market capitalization stands at $7.88 billion.

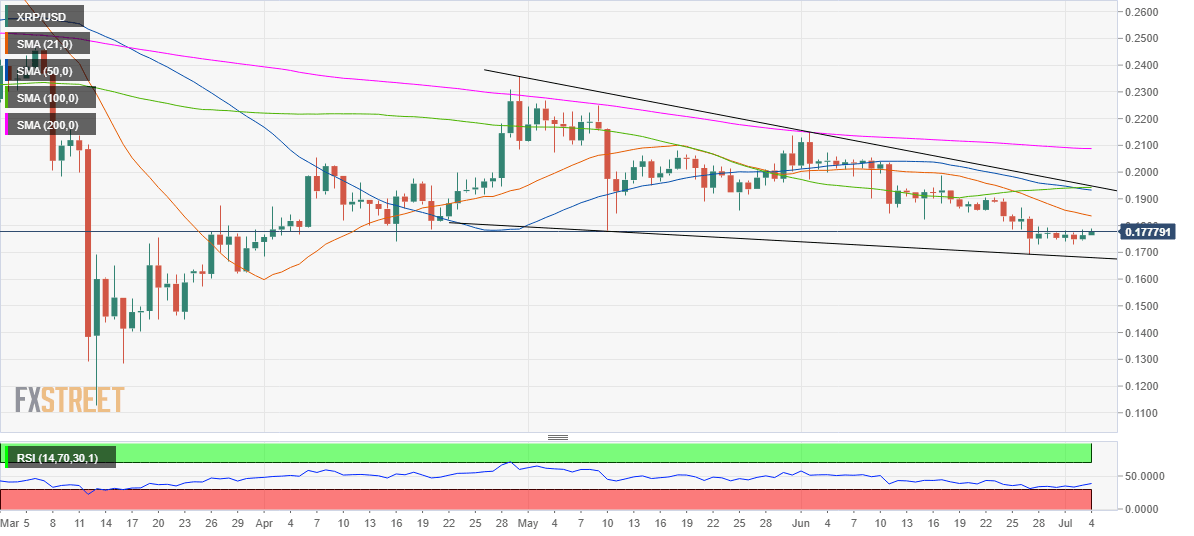
From a medium-term technical perspective, the No.4 is trending in a potential falling wedge pattern on the daily chart, suggesting the continuation of the previous uptrend should the formation get confirmed above the falling trendline resistance at 0.1948.

Until then the price is likely to remain range-bound to bearish, as long as it holds below the 21-day Simple Moving Average (DMA), now at 0.1835.

The daily Relative Strength Index (RSI) stays below the 50.0 midline but points upwards, suggesting that the price could challenge the 21-DMA in the coming days.

If the bulls manage to take out the latter, the No. 4 coin will see the buying pressure accelerating, as it looks to test the key supply zone around 0.1940, where the falling trendline resistance, 100 and 5-DMA coincide.

A decisive breakthrough will validate the pattern, calling for a test of the horizontal 200-DMA at 0.2088 en route the pattern target above 0.2500, which could likely be reached over the coming quarter.

It’s going to be an uphill task for the XRP buyers, as they will have face a stack of key healthy resistance levels on the way north.

Meanwhile, any pullbacks are likely to meet strong demand at the falling trendline support of 0.1680.

XRP/USD daily chart

fxsoriginal


XRP/USD key levels to consider


XRP/USD

Overview
Today last price 0.1776
Today Daily Change 0.0012
Today Daily Change % 0.68
Today daily open 0.1764
 
Trends
Daily SMA20 0.1839
Daily SMA50 0.1937
Daily SMA100 0.1943
Daily SMA200 0.2088
 
Levels
Previous Daily High 0.1787
Previous Daily Low 0.1745
Previous Weekly High 0.1798
Previous Weekly Low 0.1729
Previous Monthly High 0.2147
Previous Monthly Low 0.1692
Daily Fibonacci 38.2% 0.1771
Daily Fibonacci 61.8% 0.1761
Daily Pivot Point S1 0.1744
Daily Pivot Point S2 0.1723
Daily Pivot Point S3 0.1702
Daily Pivot Point R1 0.1786
Daily Pivot Point R2 0.1808
Daily Pivot Point R3 0.1828


Information on these pages contains forward-looking statements that involve risks and uncertainties. Markets and instruments profiled on this page are for informational purposes only and should not in any way come across as a recommendation to buy or sell in these assets. You should do your own thorough research before making any investment decisions. FXStreet does not in any way guarantee that this information is free from mistakes, errors, or material misstatements. It also does not guarantee that this information is of a timely nature. Investing in Open Markets involves a great deal of risk, including the loss of all or a portion of your investment, as well as emotional distress. All risks, losses and costs associated with investing, including total loss of principal, are your responsibility. The views and opinions expressed in this article are those of the authors and do not necessarily reflect the official policy or position of FXStreet nor its advertisers. The author will not be held responsible for information that is found at the end of links posted on this page.

If not otherwise explicitly mentioned in the body of the article, at the time of writing, the author has no position in any stock mentioned in this article and no business relationship with any company mentioned. The author has not received compensation for writing this article, other than from FXStreet.

FXStreet and the author do not provide personalized recommendations. The author makes no representations as to the accuracy, completeness, or suitability of this information. FXStreet and the author will not be liable for any errors, omissions or any losses, injuries or damages arising from this information and its display or use. Errors and omissions excepted.

The author and FXStreet are not registered investment advisors and nothing in this article is intended to be investment advice.

Recommended content


Recommended Content

Editors’ Picks

Shiba Inu eyes positive returns in April as SHIB price inches towards $0.000015

Shiba Inu eyes positive returns in April as SHIB price inches towards $0.000015

Shiba Inu's on-chain metrics reveal robust adoption, as addresses with balances surge to 1.4 million. Shiba Inu's returns stand at a solid 14.4% so far in April, poised to snap a three-month bearish trend from earlier this year. 

AI tokens TAO, FET, AI16Z surge despite NVIDIA excluding crypto-related projects from its Inception program

AI tokens TAO, FET, AI16Z surge despite NVIDIA excluding crypto-related projects from its Inception program

AI tokens, including Bittensor and Artificial Superintelligence Alliance, climbed this week, with ai16z still extending gains at the time of writing on Friday. The uptick in prices of AI tokens reflects a broader bullish sentiment across the cryptocurrency market. 

Bitcoin Weekly Forecast: BTC consolidates after posting over 10% weekly surge 

Bitcoin Weekly Forecast: BTC consolidates after posting over 10% weekly surge 

Bitcoin price is consolidating around $94,000 at the time of writing on Friday, holding onto the recent 10% increase seen earlier this week. This week’s rally was supported by strong institutional demand, as US spot ETFs recorded a total inflow of $2.68 billion until Thursday.

XRP price could renew 25% breakout bid on surging institutional and retail adoption

XRP price could renew 25% breakout bid on surging institutional and retail adoption

Ripple price consolidates, trading at $2.18 at the time of writing on Friday, following mid-week gains to $2.30. The rejection from this weekly high led to the price of XRP dropping to the previous day’s low at $2.11, followed by a minor reversal.

Bitcoin Weekly Forecast: BTC consolidates after posting over 10% weekly surge 

Bitcoin Weekly Forecast: BTC consolidates after posting over 10% weekly surge 

Bitcoin (BTC) price is consolidating around $94,000 at the time of writing on Friday, holding onto the recent 10% increase seen earlier this week.

Read full analysis
The Best brokers to trade EUR/USD

The Best brokers to trade EUR/USD

SPONSORED Discover the top brokers for trading EUR/USD in 2025. Our list features brokers with competitive spreads, fast execution, and powerful platforms. Whether you're a beginner or an expert, find the right partner to navigate the dynamic Forex market.

Read More

BTC

ETH

XRP