|

Ripple Technical Analysis: XRP/USD bulls take price above $0.27-level

  • XRP/USD has had two straight bullish sessions.
  • The Elliott Oscillator has had 12 straight red sessions, dropping from 0.048 to -0.0115.

XRP/USD daily chart

XRP/USD daily chart

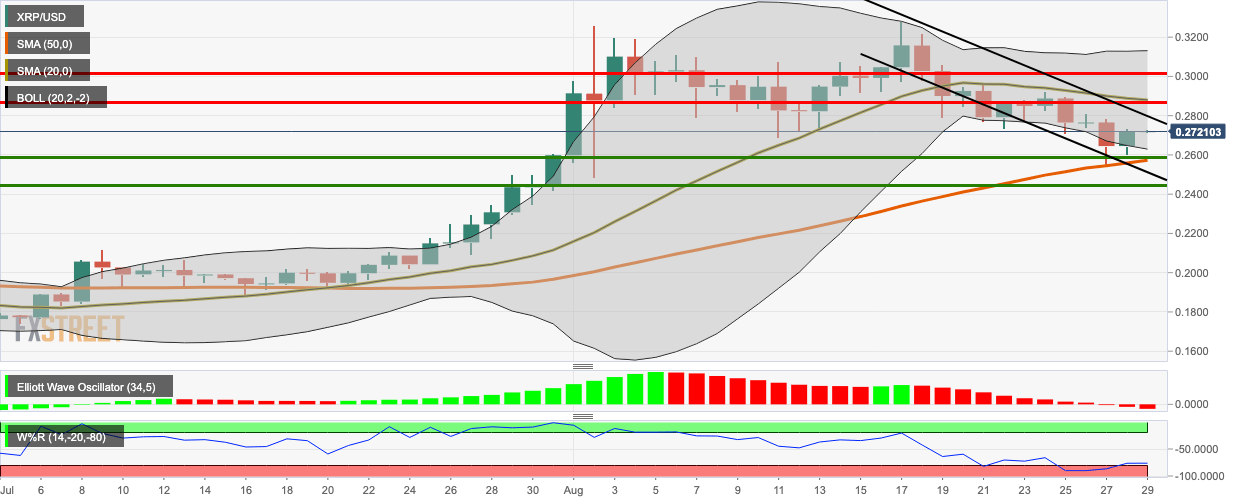
XRP/USD bulls retained control of the market as the price went up from $0.2645 to $0.2721 in the early hours of Saturday. The price is trending in a downward channel formation and hovering inside the lower half of the 20-day Bollinger Band. The Elliott Oscillator has had 12 straight red sessions, dropping from 0.048 to -0.0115. This indicates that the overall market sentiment is still bearish. 

William’s %R has crept out of the oversold zone and is currently trending around -74. XRP/USD daily chart has strong resistance levels at $0.2864 (SMA 20) and $0.3017. On the downside, we have two healthy support levels at $0.2589 (SMA 50) and $0.2447.

Key levels

XRP/USD

Overview
Today last price0.2717
Today Daily Change-0.0003
Today Daily Change %-0.11
Today daily open0.272
 
Trends
Daily SMA200.2888
Daily SMA500.2559
Daily SMA1000.224
Daily SMA2000.2163
 
Levels
Previous Daily High0.2734
Previous Daily Low0.2603
Previous Weekly High0.2922
Previous Weekly Low0.2547
Previous Monthly High0.2608
Previous Monthly Low0.1729
Daily Fibonacci 38.2%0.2684
Daily Fibonacci 61.8%0.2653
Daily Pivot Point S10.2637
Daily Pivot Point S20.2554
Daily Pivot Point S30.2505
Daily Pivot Point R10.2769
Daily Pivot Point R20.2818
Daily Pivot Point R30.2901


Author

Rajarshi Mitra

Rajarshi Mitra

Independent Analyst

Rajarshi entered the blockchain space in 2016. He is a blockchain researcher who has worked for Blockgeeks and has done research work for several ICOs. He gets regularly invited to give talks on the blockchain technology and cryptocurrencies.

More from Rajarshi Mitra
Share:

Editor's Picks

Sui extends sideways action ahead of Grayscale’s GSUI ETF launch

Sui is extending its downtrend for the second consecutive day, trading at 0.95 at the time of writing on Wednesday. The Layer-1 token is down over 16% in February and approximately 34% from the start of the year, aligning with the overall bearish sentiment across the crypto market.

XRP pares losses, targets breakout above $1.50 as ETF demand diminishes

XRP pares losses as bulls target a short-term breakout above $1.50. The MACD upholds a buy signal while the MFI indicator rises above the midline, suggesting a potential bullish shift.

Ghost holding in BlackRock’s IBIT sparks Chinese Bitcoin investment whispers

A new entity identified in BlackRock's quarterly filing for its Bitcoin (BTC) Exchange-Traded Fund (ETF) IBIT has sparked rumors of Chinese investment under the name of Zhang Hui, despite the nationwide ban on the Crypto King. 

Crypto Today: Bitcoin, Ethereum, XRP rebound slightly as technicals signal bullish shift

The cryptocurrency market is showing signs of a gradual recovery, with Bitcoin (BTC), Ethereum (ETH), and Ripple (XRP) all edging higher at the time of writing on Wednesday after the price declines seen a day earlier. 

Bitcoin Price Annual Forecast: BTC holds long-term bullish structure heading into 2026

Bitcoin (BTC) is wrapping up 2025 as one of its most eventful years, defined by unprecedented institutional participation, major regulatory developments, and extreme price volatility.

Bitcoin: BTC bears aren’t done yet

Bitcoin (BTC) price slips below $67,000 at the time of writing on Friday, remaining under pressure and extending losses of nearly 5% so far this week.