- Ripple recovers from the dip at $0.1785 and holds the ground above $0.18.
- XRP/USD risks free-fall to $0.14 if support areas at $0.18 and $0.1785 give in to the selling pressure.
Ripple has been exploring lower levels under $0.20 this June. Over the last 24 hours, the digital asset has dived below several support areas at $0.19, $0.1850 and $0.18. An intraday low has been formed at $0.1785 on Thursday. However, XRP has recovered to trade at $0.1820 at the time of writing.
The cryptoasset is likely to contain the losses above $0.18 as long as the RSI in the daily range holds above 35. Recovery towards the average would signal possible price action above $0.1850 and $0.19 resistance zones.
Looking at the MACD in the same range, traders cannot ignore the influence sellers have over the price. The indicator is moving sidelong marginally below the midline. A minor bearish divergence highlights the downward pressure, perhaps keeping buyers away from significant upward movement.
On the flip side, if losses continue below $0.18 as well as $0.1785, Ripple could lose any chances of recovery until it finds balance at $0.14 (primary support). Note that in March, XRP plunged to $0.11 due to the Coronavirus-triggered crash across the market. On the brighter side, a fall of such extent could increase the demand for the token and eventually catapult it above $0.20.
Related content: Cryptocurrency Market Update: Bloodbath as Bitcoin shoots under $9,000, Ethereum and Ripple bleed
XRP/USD daily chart
 (41)-637286627387997735.png)
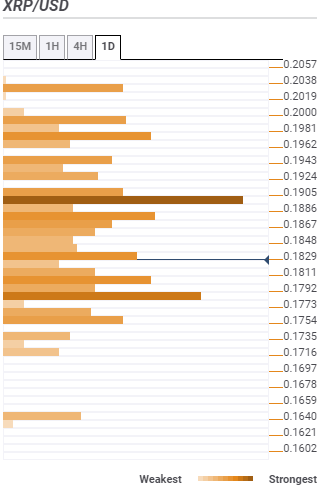
Ripple confluence resistance and support levels
Resistance one: $0.1829 – The region highlights the Bollinger Band 1-hour middle curve, the Fibo 23.6% one-day, the previous high 15-minutes and the SMA 50 15-minutes indicators among others.
Resistance two: $0.1886 – Hosts the Fibo 38.2% one-week, the Bollinger Band 4-hour middle curve, SMA five daily and SMA 100 1-hour.
Resistance three: $0.1950 – This is the strongest resistance zone and is home to the previous high one-day, the SMA 200 1-hour, and SMA ten 1-day.
Support one: $0.1811 – The zone is the initial support and is home to the Bollinger band daily lower curve, SMA ten 15-minutes and the previous low 15-minutes.
Support two: $0.1792 – Highlights the previous low 4-hour, the Bollinger Band 15-minutes lower curve and the previous month low.
Information on these pages contains forward-looking statements that involve risks and uncertainties. Markets and instruments profiled on this page are for informational purposes only and should not in any way come across as a recommendation to buy or sell in these assets. You should do your own thorough research before making any investment decisions. FXStreet does not in any way guarantee that this information is free from mistakes, errors, or material misstatements. It also does not guarantee that this information is of a timely nature. Investing in Open Markets involves a great deal of risk, including the loss of all or a portion of your investment, as well as emotional distress. All risks, losses and costs associated with investing, including total loss of principal, are your responsibility. The views and opinions expressed in this article are those of the authors and do not necessarily reflect the official policy or position of FXStreet nor its advertisers. The author will not be held responsible for information that is found at the end of links posted on this page.
If not otherwise explicitly mentioned in the body of the article, at the time of writing, the author has no position in any stock mentioned in this article and no business relationship with any company mentioned. The author has not received compensation for writing this article, other than from FXStreet.
FXStreet and the author do not provide personalized recommendations. The author makes no representations as to the accuracy, completeness, or suitability of this information. FXStreet and the author will not be liable for any errors, omissions or any losses, injuries or damages arising from this information and its display or use. Errors and omissions excepted.
The author and FXStreet are not registered investment advisors and nothing in this article is intended to be investment advice.
Recommended Content
Editors’ Picks

Dogecoin and Bitcoin Cash Price Prediction: Funding rates decrease indicate weakness in DOGE and BCH
Dogecoin and Bitcoin Cash registered 3% and 8% losses on Tuesday following increased selling pressure from the futures market. The decline comes amid large-cap cryptos like Bitcoin, Ether and XRP, holding still with slight gains.

XRP could sustain rally amid growing ETF and SEC vote prospects
Ripple flaunted a bullish outlook, trading at $2.1505 on Tuesday. Investor risk appetite has continued to grow since the middle of last week, propping XRP for a sustainable upward move triggered by the swift decision by US President Donald Trump to suspend reciprocal tariffs for 90 days.

VeChain Price Forecast: VET bulls aim for a double-digit rally
VeChain price hovers around $0.023 on Tuesday after breaking above a falling wedge pattern the previous day; a breakout of this pattern favors the bulls. Bybit announced on Monday that VET would be listed on its exchange. Moreover, the technical outlook suggests rallying ahead, targeting double-digit gains.
Dogecoin, Shiba Inu and Fartcoin price prediction if Bitcoin crosses $100K this week
The meme coin market fell sharply on Monday, shedding 4.8% in market capitalization to settle at $49.25 billion, according to data compiled from CoinGecko. The sell-off coincided with increased volatility across broader crypto markets while investors rotated funds into Bitcoin briefly tested $85,000.

Bitcoin Weekly Forecast: Market uncertainty lingers, Trump’s 90-day tariff pause sparks modest recovery
Bitcoin (BTC) price extends recovery to around $82,500 on Friday after dumping to a new year-to-date low of $74,508 to start the week. Market uncertainty remains high, leading to a massive shakeout, with total liquidations hitting $2.18 billion across crypto markets.

The Best brokers to trade EUR/USD
SPONSORED Discover the top brokers for trading EUR/USD in 2025. Our list features brokers with competitive spreads, fast execution, and powerful platforms. Whether you're a beginner or an expert, find the right partner to navigate the dynamic Forex market.