- Ripple bounces off in preparation for massive recovery above the ascending channel middle boundary.
- The MVRV on-chain metric model shows that XRP is back in the buy zone.
- A correction will come into the picture if Ripple fails to close the day above the 4-hour 200 SMA.
Ripple is nurturing an uptrend, following the recent breakdown to $0.35. The losses XRP suffered spread across the board in the market. Several tentative support levels did little to stop the sharp drop, including $0.55 and $0.4. Meanwhile, the cross-border token bulls have regained control, ready for another upswing to $1.
Ripple fights for another breakout
The drop to $0.35 appears to have been a blessing in disguise, allowing more investors to join the market at a lower price. XRP has recovered from the dip and now exchanging hands at $0.48. On the upside, bulls are battling the hurdle at the 50 Simple Moving Average (SMA) on the 4-hour chart.
Trading above this critical level is likely to pave the way for gains above the ascending parallel channel middle boundary. Another break above $0.55 will trigger massive buy orders in anticipation of gains eyeing $1. For now, the least resistance path is upwards, especially with the Relative Strength Index (RSI) on the 4-hour chart, bouncing off the oversold region and heading toward the midline.
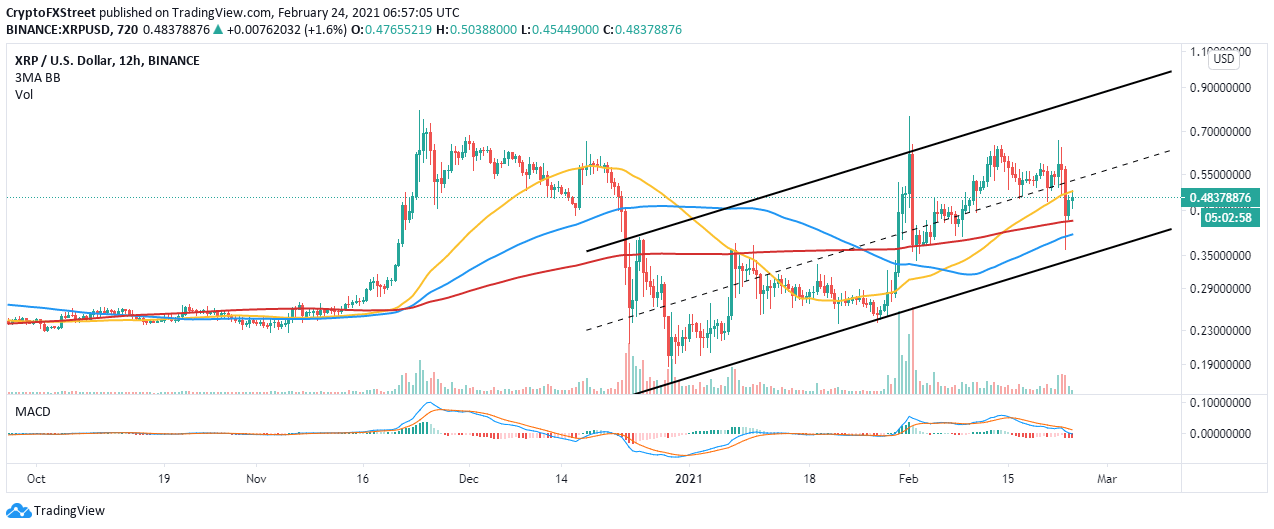
XRP/USD 4-hour chart
Santiment’s MVRV on-chain model reveals that Ripple is back in the buy zone. This metric measures the average profit or loss of the cross-border tokens that moved over the last 30 days compared to the price when each of the XRP tokens last moved.
A low MVRV ratio shows that most investors are at a loss or have barely broken even on their investment, hence the unlikelihood of selling. On the other hand, when the MVRV is high most traders are usually in profit and are most likely to sell.
%20[10.15.38,%2024%20Feb,%202021]-637497486078107313.png)
Ripple MVRV chart
Consequently, improving network growth is another bullish signal. The chart below shows the recent consistent increase in the number of new addresses joining the network. Such an increase indicates that user adoption is growing and is a bullish signal for the token. Therefore, XRP is likely to continue with the uptrend in tandem with improving network growth.
%20[10.18.59,%2024%20Feb,%202021]-637497486342789862.png)
Ripple network growth
Looking at the other side of the fence
It is worth noting that Ripple’s upswing may fail to materialize if the immediate resistance at the 50 SMA on the 4-hour chart remains unshaken. Besides, the channel’s middle boundary is in line to hinder growth, adding to the selling pressure. On the downside, support at the 200 SMA must be guarded at costs to avert losses back to $0.35.
Information on these pages contains forward-looking statements that involve risks and uncertainties. Markets and instruments profiled on this page are for informational purposes only and should not in any way come across as a recommendation to buy or sell in these assets. You should do your own thorough research before making any investment decisions. FXStreet does not in any way guarantee that this information is free from mistakes, errors, or material misstatements. It also does not guarantee that this information is of a timely nature. Investing in Open Markets involves a great deal of risk, including the loss of all or a portion of your investment, as well as emotional distress. All risks, losses and costs associated with investing, including total loss of principal, are your responsibility. The views and opinions expressed in this article are those of the authors and do not necessarily reflect the official policy or position of FXStreet nor its advertisers. The author will not be held responsible for information that is found at the end of links posted on this page.
If not otherwise explicitly mentioned in the body of the article, at the time of writing, the author has no position in any stock mentioned in this article and no business relationship with any company mentioned. The author has not received compensation for writing this article, other than from FXStreet.
FXStreet and the author do not provide personalized recommendations. The author makes no representations as to the accuracy, completeness, or suitability of this information. FXStreet and the author will not be liable for any errors, omissions or any losses, injuries or damages arising from this information and its display or use. Errors and omissions excepted.
The author and FXStreet are not registered investment advisors and nothing in this article is intended to be investment advice.
Recommended Content
Editors’ Picks

Bitcoin, Ethereum and XRP steady as China slaps 125% tariff on US, weekend sell-off looming?
The Cryptocurrency market shows stability at the time of writing on Friday, with Bitcoin (BTC) holding steady at $82,584, Ethereum (ETH) at $1,569, and Ripple (XRP) maintaining its position above $2.00.

Bitcoin Weekly Forecast: Market uncertainty lingers, Trump’s 90-day tariff pause sparks modest recovery
Bitcoin price extends recovery to around $82,500 on Friday after dumping to a new year-to-date low of $74,508 to start the week. Market uncertainty remains high, leading to a massive shakeout, with total liquidations hitting $2.18 billion across crypto markets.

Bitcoin, Ethereum, Dogecoin and Cardano stabilze – Why crypto is in limbo
Bitcoin, Ethereum, Dogecoin and Cardano stabilize on Friday as crypto market capitalization steadies around $2.69 trillion. Crypto traders are recovering from the swing in token prices and the Monday bloodbath.

Can FTX’s 186,000 unstaked SOL dampen Solana price breakout hopes?
Solana price edges higher and trades at $117.31 at the time of writing on Friday, marking a 3.4% increase from the $112.80 open. The smart contracts token corrected lower the previous day, following a sharp recovery to $120 induced by US President Donald Trump’s 90-day tariff pause on Wednesday.
Bitcoin Weekly Forecast: Market uncertainty lingers, Trump’s 90-day tariff pause sparks modest recovery
Bitcoin (BTC) price extends recovery to around $82,500 on Friday after dumping to a new year-to-date low of $74,508 to start the week. Market uncertainty remains high, leading to a massive shakeout, with total liquidations hitting $2.18 billion across crypto markets.

The Best brokers to trade EUR/USD
SPONSORED Discover the top brokers for trading EUR/USD in 2025. Our list features brokers with competitive spreads, fast execution, and powerful platforms. Whether you're a beginner or an expert, find the right partner to navigate the dynamic Forex market.