Ripple Price Forecast: Bearish sentiment in the broader crypto market ignites liquidations
- XRP price retreats over 3% amid a market-wide correction led by Bitcoin.
- The drop in the derivatives market’s Open Interest to $3.84 billion signals waning confidence in XRP’s uptrend
- In the last 24 hours, long position liquidations have exceeded $10 million, compared to almost $3 million in short positions.

Ripple (XRP) price is reversing gains at the time of writing on Thursday, following a widespread recovery in the cryptocurrency market on Wednesday. XRP surged alongside Bitcoin (BTC), hitting a daily high of $2.30 on Wednesday, as investors positively reacted to United States (US) President Donald Trump’s more conciliatory stance on Federal Reserve (Fed) Chair Jerome Powell and China. The US is optimistic that it will soon resolve the trade and tariff standoff with China, hinting at the potential easing of tariffs ahead of a comprehensive agreement in two years.
XRP price retests short-term support as liquidations surge
XRP price hovers at $2.14 at the time of writing, reflecting bearish sentiment in the wider cryptocurrency market. According to derivatives market data from Coinglass, the XRP Open Interest (OI) has decreased by 2.67% to $3.84 billion over the last 24 hours. This drawback in the price of XRP triggered liquidations on the last day, where long positions valued at $10.05 million were forcibly closed, compared to approximately $3 million in short positions.
The drop in XRP’s derivatives OI reflects a significant decline in trader confidence, which could lead to reduced market participation. In addition to the liquidation of long positions, this mirrors heightened selling pressure, as bullish traders are forcefully ejected from the market.
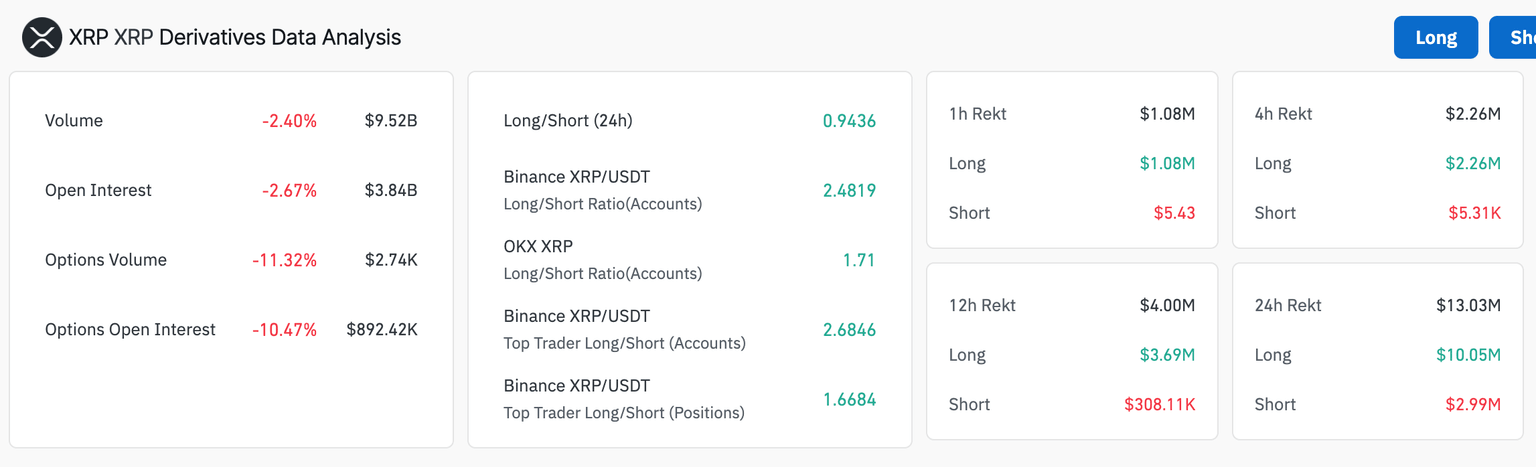
XRP derivatives data | Source: Coinglass
The 24-hour long/short ratio of 0.9436, combined with a 2.4% drop in trading volume to $9.52 billion, suggests waning market activity. XRP price could face increased downward pressure, potentially breaking below key support areas and accelerating its decline in the near term.
Is the XRP price pullback temporary?
XRP price hovers near the 100 Exponential Moving Average (EMA) at $2.14 after testing the immediate support at $2.11 provided by the 50 EMA on the 8-hour chart below. This follows a reversal from Wednesday’s high of $2.30.
The Relative Strength Index (RSI) indicator’s position at 52.42, as it approaches the midline, reinforces the bearish sentiment. Beyond the 50 EMA support, the next critical level for XRP is $2.00, a significant anchor since March. April’s low, approximately $1.62, is another level to keep in mind in the coming days and weeks.

XRP/USD 8-hour chart
If XRP price navigates the current challenges and reverses the trend upwards, an inverse head and shoulders pattern highlighted on the chart above could return in focus, projecting a 26% increase to $2.74. This target is determined by measuring the distance between the dotted line and the lowest point of the pattern’s head and then extrapolating above the breakout point.
Cryptocurrency metrics FAQs
The developer or creator of each cryptocurrency decides on the total number of tokens that can be minted or issued. Only a certain number of these assets can be minted by mining, staking or other mechanisms. This is defined by the algorithm of the underlying blockchain technology. On the other hand, circulating supply can also be decreased via actions such as burning tokens, or mistakenly sending assets to addresses of other incompatible blockchains.
Market capitalization is the result of multiplying the circulating supply of a certain asset by the asset’s current market value.
Trading volume refers to the total number of tokens for a specific asset that has been transacted or exchanged between buyers and sellers within set trading hours, for example, 24 hours. It is used to gauge market sentiment, this metric combines all volumes on centralized exchanges and decentralized exchanges. Increasing trading volume often denotes the demand for a certain asset as more people are buying and selling the cryptocurrency.
Funding rates are a concept designed to encourage traders to take positions and ensure perpetual contract prices match spot markets. It defines a mechanism by exchanges to ensure that future prices and index prices periodic payments regularly converge. When the funding rate is positive, the price of the perpetual contract is higher than the mark price. This means traders who are bullish and have opened long positions pay traders who are in short positions. On the other hand, a negative funding rate means perpetual prices are below the mark price, and hence traders with short positions pay traders who have opened long positions.
Author

John Isige
FXStreet
John Isige is a seasoned cryptocurrency journalist and markets analyst committed to delivering high-quality, actionable insights tailored to traders, investors, and crypto enthusiasts. He enjoys deep dives into emerging Web3 tren


