Ripple Price Prediction: XRP bulls can ignore pullback from immediate hurdle around $0.49


  • Ripple picks up bids after snapping a four-day winning streak.
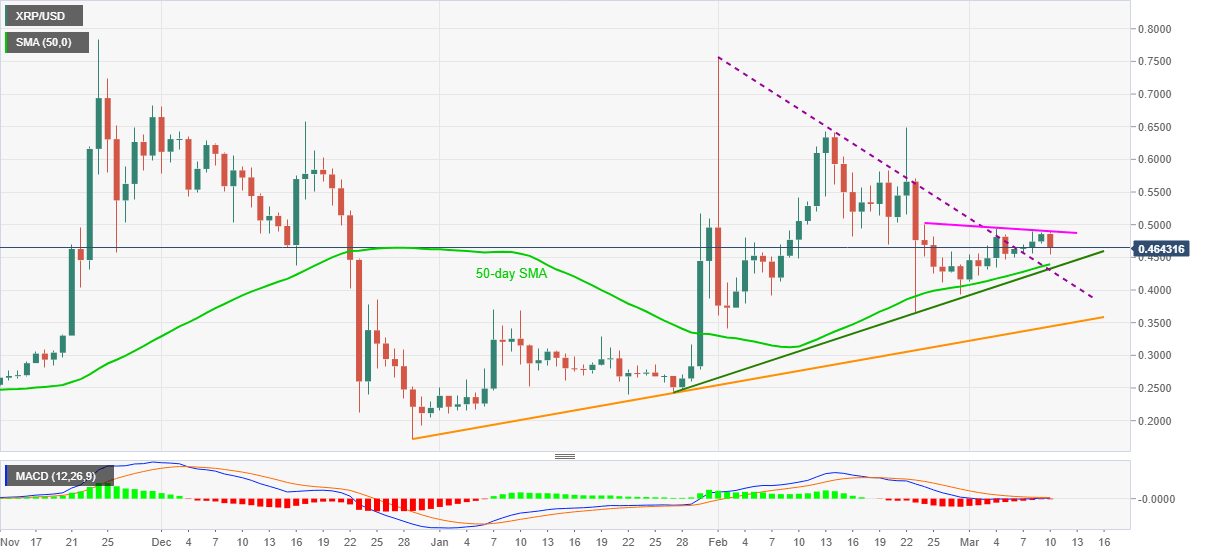
  • Successful break of five-week-old resistance, trading beyond 50-day SMA and an ascending trend line from January 27 back bulls.
  • Sellers should look for entries below $0.4300, buyers may wait for fresh monthly high.

XRP/USD fails to keep the sellers on board, despite recent declines, as the quote firms up around mid-$0.4600s during early Thursday. The altcoin took a U-turn from a two-week-old resistance line the previous day but couldn’t extend the losses to even the nearest support, namely the 50-day SMA.

Also favoring ripple buyers could be the XRP/USD trading above a six-week-long support line and a clear run-up beyond the previous resistance line from February 01, not to forget the receding bearish bias of the MACD.

That said, the XRP/USD bulls currently eye the monthly top near $0.4950 ahead of the targeting the $0.5000 threshold.

During the quote’s sustained run-up past-$0.5000, $0.5830 and the mid-February tops near $0.6430 should be watched before the previous month’s top of $0.7564.

Should XRP/USD stays weak below the stated resistance line, currently around $0.4900, sellers can keep a 50-day SMA level of $0.4390 on the radar.

Though, a confluence of previous resistance and an ascending trend line from late January, currently around $0.4300, will be a tough nut to crack for the XRP/USD bears.

Overall, ripple buyers hold the reins but look for conviction before flashing notable gains.

XRP/USD daily chart

Trend: Bullish

Additional important levels

Overview
Today last price 0.4663
Today Daily Change -0.0192
Today Daily Change % -3.95%
Today daily open 0.4855
 
Trends
Daily SMA20 0.4768
Daily SMA50 0.4359
Daily SMA100 0.4215
Daily SMA200 0.3522
 
Levels
Previous Daily High 0.4876
Previous Daily Low 0.4717
Previous Weekly High 0.4945
Previous Weekly Low 0.3934
Previous Monthly High 0.7565
Previous Monthly Low 0.3406
Daily Fibonacci 38.2% 0.4815
Daily Fibonacci 61.8% 0.4778
Daily Pivot Point S1 0.4756
Daily Pivot Point S2 0.4657
Daily Pivot Point S3 0.4597
Daily Pivot Point R1 0.4915
Daily Pivot Point R2 0.4975
Daily Pivot Point R3 0.5075


Information on these pages contains forward-looking statements that involve risks and uncertainties. Markets and instruments profiled on this page are for informational purposes only and should not in any way come across as a recommendation to buy or sell in these assets. You should do your own thorough research before making any investment decisions. FXStreet does not in any way guarantee that this information is free from mistakes, errors, or material misstatements. It also does not guarantee that this information is of a timely nature. Investing in Open Markets involves a great deal of risk, including the loss of all or a portion of your investment, as well as emotional distress. All risks, losses and costs associated with investing, including total loss of principal, are your responsibility. The views and opinions expressed in this article are those of the authors and do not necessarily reflect the official policy or position of FXStreet nor its advertisers. The author will not be held responsible for information that is found at the end of links posted on this page.

If not otherwise explicitly mentioned in the body of the article, at the time of writing, the author has no position in any stock mentioned in this article and no business relationship with any company mentioned. The author has not received compensation for writing this article, other than from FXStreet.

FXStreet and the author do not provide personalized recommendations. The author makes no representations as to the accuracy, completeness, or suitability of this information. FXStreet and the author will not be liable for any errors, omissions or any losses, injuries or damages arising from this information and its display or use. Errors and omissions excepted.

The author and FXStreet are not registered investment advisors and nothing in this article is intended to be investment advice.

Join Telegram

Recommended content


Recommended Content

Editors’ Picks

Celebrity meme coins controversy continues amid Pump.fun revenue dominance

Celebrity meme coins controversy continues amid Pump.fun revenue dominance

Pump.fun outperformed the Ethereum blockchain on Tuesday after raking in $1.99 million. Following this achievement, a meme coin based on actress Sydney Sweeney was the subject of controversy after its developers dumped their bags on investors.

More Meme Coins News

PEPE's on-chain metrics indicate potential rally after weeks of silence

PEPE's on-chain metrics indicate potential rally after weeks of silence

PEPE has struggled to see any significant price move after reaching an all-time high in May. Increased adoption rate and low MVRV ratio indicate a bullish run may be on the horizon. A single PEPE outflow from Binance worth $14.7 million gives credence to signs of bullish expectation.

More Pepe News

Ethereum has failed to overcome key resistance despite bullish sentiment surrounding ETH ETF

Ethereum has failed to overcome key resistance despite bullish sentiment surrounding ETH ETF

Ethereum (ETH) is down more than 1.4% on Tuesday following another ETH sale from the Ethereum Foundation. Meanwhile, crypto exchange Gemini's recent report reveals that ETH ETF could see about $5 billion in net inflows within six months of launch.

More Ethereum News

Crypto community blasts Polkadot following report of treasury spending

Crypto community blasts Polkadot following report of treasury spending

Polkadot reports $87 million of treasury spending during H1. Crypto community members expressed harsh feelings toward the DOT team's high spending. DOT is up more than 2% in the past 24 hours but risks correction following the report.

More Polkadot News

Bitcoin: BTC price correction could end in July, according to seasonal data

Bitcoin: BTC price correction could end in July, according to seasonal data

Bitcoin (BTC) price appears poised for a decline this week, influenced by slight outflows in US spot ETFs, selling activity among BTC miners, and a combined transfer of 4,690.28 BTC to centralized exchanges by the US and German governments.

Read full analysis

BTC

ETH

XRP