• Ripple price saw its gains being paired back almost in full on Tuesday.
  • XRP is hanging between cap and floor, clueless about where to go next.
  • As February nears, the window of opportunities for this rally is closing.

Ripple's (XRP) price has printed a staggering performance for January, with a 44% price upswing from bottom to top. Finally, the crypto asset is becoming one-directional, making it a bit easier and clearer to trade since buying low and selling high is the best approach in these circumstances. Traders not yet involved in the price action are best to remain sidelined until one of the levels mentioned below appears. Together they offer at least a 13% profit potential

Ripple price rally inevitable with plenty of support provided

Ripple price is set to pop higher, but many traders will still have questions on where to enter. Looking at the behaviour of XRP in January, it becomes clear that both the 55-day Simple Moving Average (SMA) and the 200-day SMA are the two main levels to watch, trading currently near $0.3710 and $0.3900, respectively. Traders should enter at one of those levels as a single entry point or use the two levels as a benchmarking guide for a fade-in trade and buy in between the marked-up levels.

XRP holds a third scenario or level of relevance, which is $0.4228. This level has been used as a line in the sand for the head-and-shoulders pattern from the fall of 2022. Already twice this week, $0.4228 got pierced through with bears able to stop XRP from having a daily close above that level. This bullish pressure will be successful in its third attempt, so if the rally continues after looking for support at the two SMAs, be sure to enter the next breakout trade to the upside with a profit target at $0.4799. This trade brings between 13% to 30%  gains, depending on which scenario has played out. 
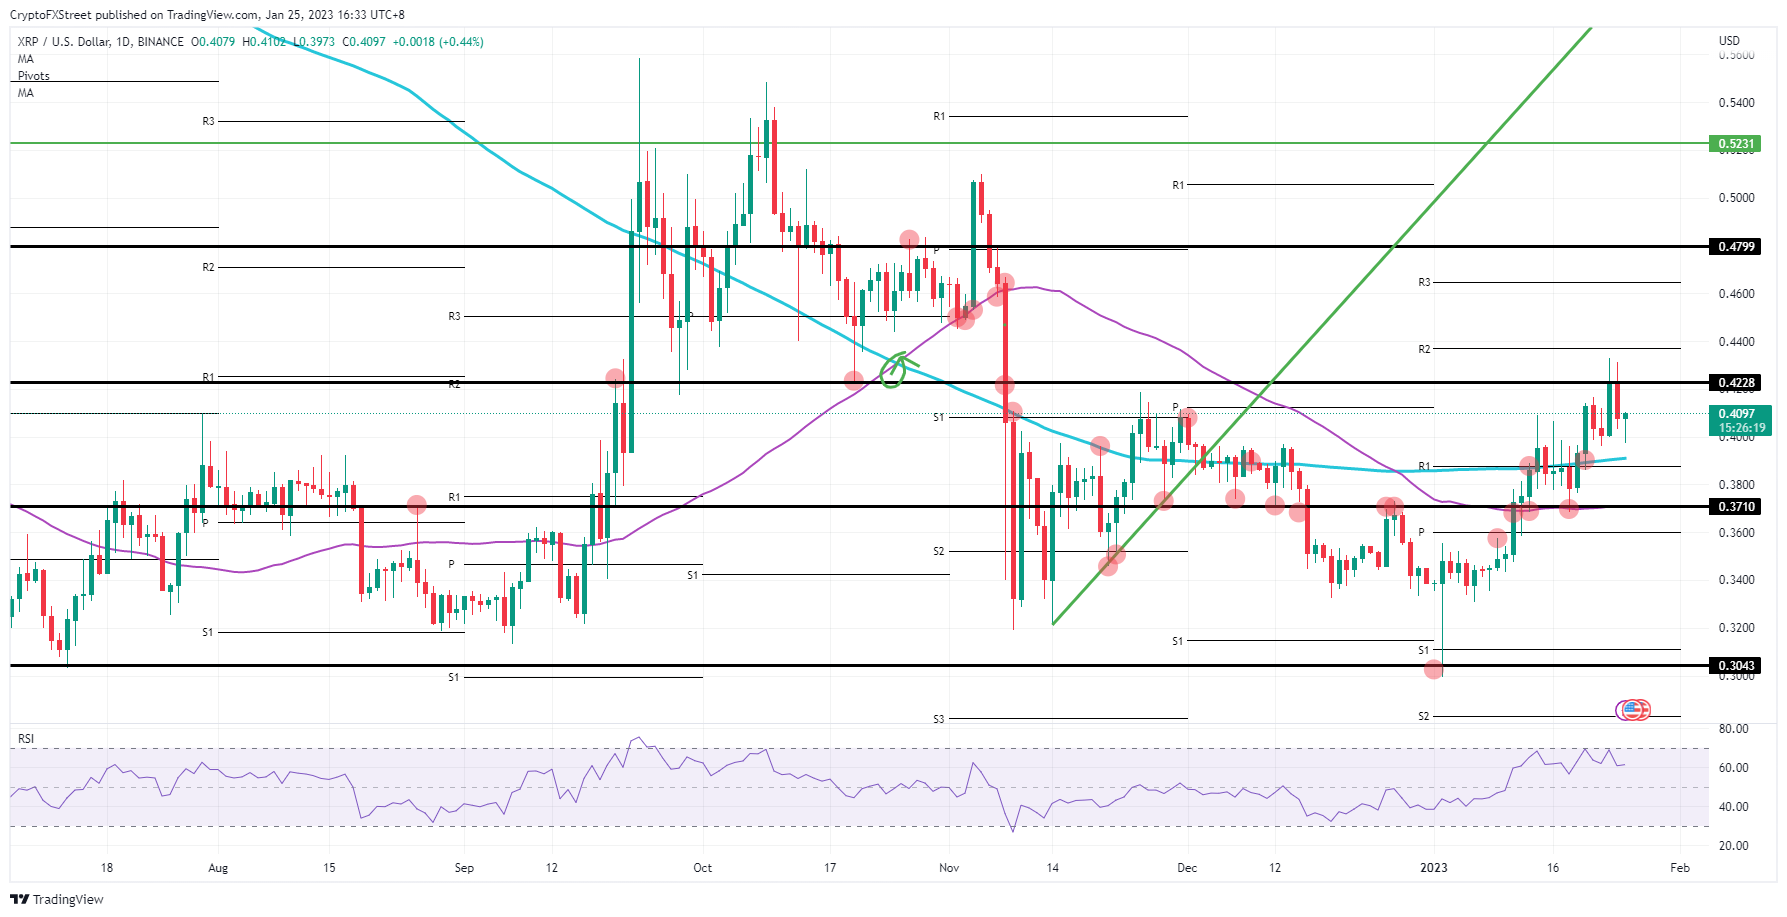
XRP/USD daily chart

XRP/USD daily chart

Unfortunately, a downside risk goes along with this, and that risk element is time. Several central banks are ready to give their first monetary policy decision for the year. With only five to six trading days left, that is a very tiny window to trade up, certainly seeing the risk and nervousness after several hawkish comments at the beginning of the year that pushed against the euphoria in markets. Should $0.3710 break on the downside test, expect to see the rally almost fully unwind with price action back at $0.30 and flirting with multi-year lows.


Information on these pages contains forward-looking statements that involve risks and uncertainties. Markets and instruments profiled on this page are for informational purposes only and should not in any way come across as a recommendation to buy or sell in these assets. You should do your own thorough research before making any investment decisions. FXStreet does not in any way guarantee that this information is free from mistakes, errors, or material misstatements. It also does not guarantee that this information is of a timely nature. Investing in Open Markets involves a great deal of risk, including the loss of all or a portion of your investment, as well as emotional distress. All risks, losses and costs associated with investing, including total loss of principal, are your responsibility. The views and opinions expressed in this article are those of the authors and do not necessarily reflect the official policy or position of FXStreet nor its advertisers. The author will not be held responsible for information that is found at the end of links posted on this page.

If not otherwise explicitly mentioned in the body of the article, at the time of writing, the author has no position in any stock mentioned in this article and no business relationship with any company mentioned. The author has not received compensation for writing this article, other than from FXStreet.

FXStreet and the author do not provide personalized recommendations. The author makes no representations as to the accuracy, completeness, or suitability of this information. FXStreet and the author will not be liable for any errors, omissions or any losses, injuries or damages arising from this information and its display or use. Errors and omissions excepted.

The author and FXStreet are not registered investment advisors and nothing in this article is intended to be investment advice.

Join Telegram

Recommended content


Recommended Content

Editors’ Picks

Ripple on-chain metrics show bullish signs amidst legal struggle with SEC, XRP eyes recovery

Ripple on-chain metrics show bullish signs amidst legal struggle with SEC, XRP eyes recovery

Ripple made a comeback above $0.48 on Tuesday and hovers above that level in Wednesday’s European session. Ripple on-chain metrics such as transaction volume and Network Realized Profit/Loss have turned bullish, supporting a recovery in the altcoin. 

More Ripple News

Bitcoin price falls amidst German government transfers, miners activity

Bitcoin price falls amidst German government transfers, miners activity

Bitcoin (BTC) extends correction on Wednesday and hovers around $61,000 after finding resistance near the $64,000 level on Monday. Recent on-chain data indicates heightened selling activity from Bitcoin miners early in the week. 

More Bitcoin News

Crypto Today: Bitcoin erases gains from end of June, Ethereum declines while Ripple holds

Crypto Today: Bitcoin erases gains from end of June, Ethereum declines while Ripple holds

Bitcoin wipes out gains from the last week of June and falls below $60,000 on Wednesday. Ethereum and top altcoins ranked by market capitalization erased gains as the inflation outlook worsened. Ripple holds on to recent gains and hovers above $0.48 on Wednesday. 

More Cryptocurrencies News

Three reasons why altcoins could shake off losses this week

Three reasons why altcoins could shake off losses this week

On-chain data from Santiment shows that altcoins are currently in the opportunity zone, or generating buy signals. The top three altcoins in the buy zone are Basic Attention Token (BAT), Chromia (CHR), and Highstreet (HIGH), per Santiment. 

More Altcoins News

Bitcoin: BTC price correction could end in July, according to seasonal data

Bitcoin: BTC price correction could end in July, according to seasonal data

Bitcoin (BTC) price appears poised for a decline this week, influenced by slight outflows in US spot ETFs, selling activity among BTC miners, and a combined transfer of 4,690.28 BTC to centralized exchanges by the US and German governments.

Read full analysis

BTC

ETH

XRP